Knowledge Graph
The Knowledge Graph is a topology view of your cloud inventory, built on Apache AGE. It renders resources and the relationships between them — dependencies, reservation coverage, and recommendation flags — on top of a hierarchical layout. For the analyses and cost-reduction recommendations computed over this graph, see FinOps Intelligence.
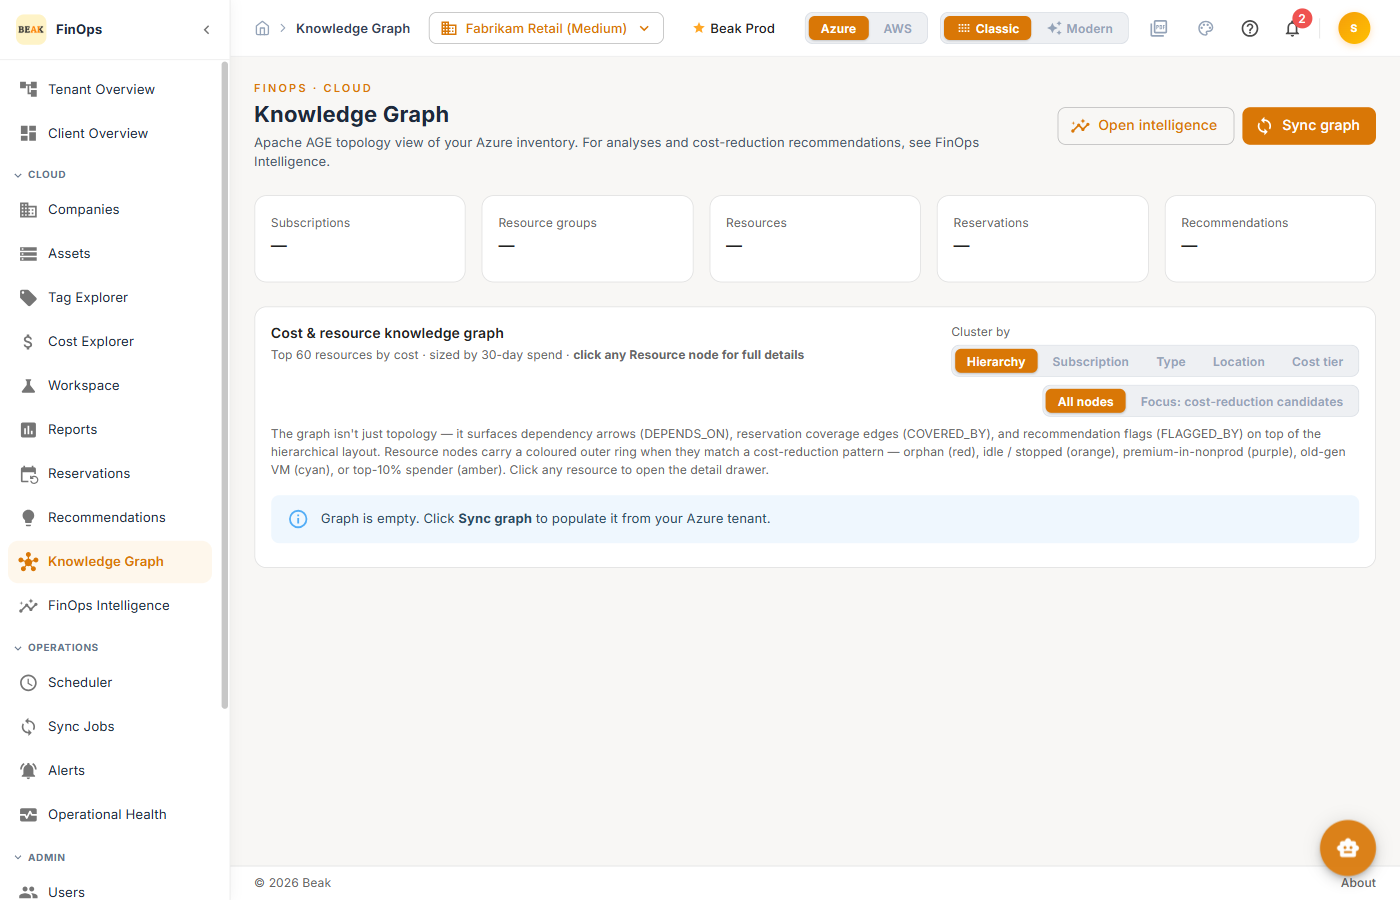
Inventory Counts
Tiles at the top summarize what the graph contains: Subscriptions, Resource groups, Resources, Reservations, and Recommendations, along with the last graph-sync time. Click Sync graph to rebuild the graph from the latest inventory.
Cost & Resource Graph
The graph shows the top resources by cost, sized by spend. Controls let you shape it:
- Cluster by — Group nodes by
Hierarchy,Subscription,Type,Location, orCost tier - Focus — Show all nodes, or focus on cost-reduction candidates
Resource nodes carry a colored outer ring when they match a cost-reduction pattern — orphan (red), idle/stopped (orange), premium-in-nonprod (purple), old-generation VM (cyan), or top-10% spender (amber). Edges show dependency (DEPENDS_ON), reservation coverage (COVERED_BY), and recommendation flags (FLAGGED_BY).
Resource Detail
Click any resource node to open its detail drawer with the resource's attributes and relationships.
Best Practices
- Sync before analysis — Rebuild the graph after a data collection so the topology reflects current inventory
- Cluster to find patterns — Cluster by Cost tier or Type to see where spend concentrates
- Follow the rings — Colored rings are a fast visual path to cost-reduction candidates
Related Pages
- FinOps Intelligence — ML analyses over this graph
- Assets — Flat resource inventory
- Recommendations — Acting on flagged resources