Configuration Management Database
The Configuration Management Database (CMDB) is a centralized repository of all IT infrastructure configuration items (CIs) and business services. It provides visibility into what assets exist, their status, environment, criticality, and ownership — with automated discovery, visual topology mapping, and data completeness analytics.
The CMDB is organized into five sections accessible from the left sidebar: Configuration Items, Services, Discovery, Network Map, and Analytics.
Configuration Items
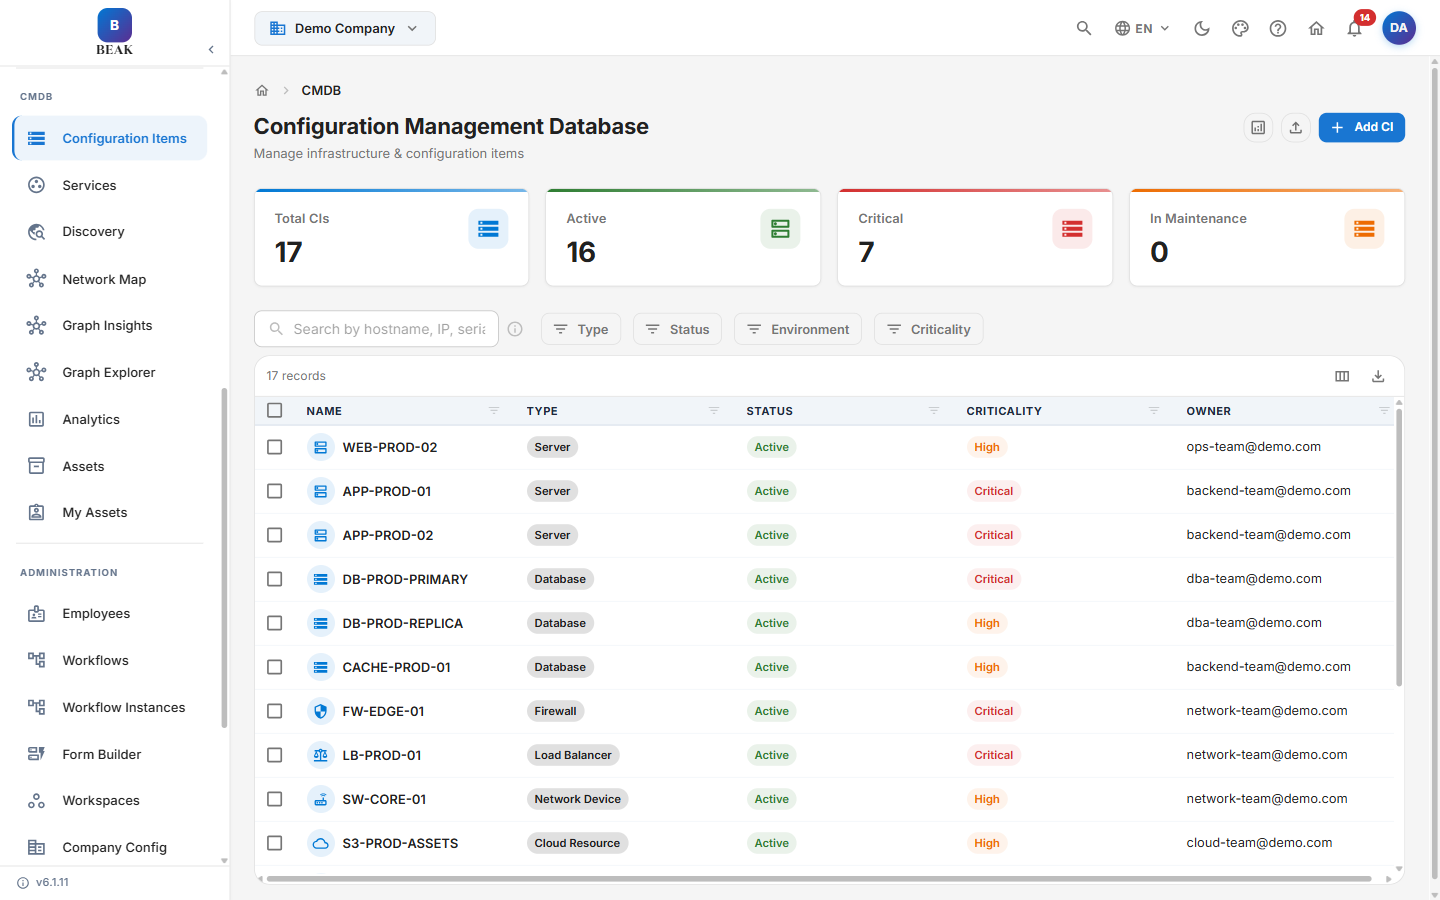
The Configuration Items section is the primary CI repository. It tracks all hardware, software, and infrastructure assets across your organization. The page header reads Configuration Management Database — Manage infrastructure & configuration items.
CMDB Dashboard
The CMDB Dashboard presents a high-level summary of overall CI health through four summary cards:
- Total CIs — The total count of all configuration items registered in the CMDB
- Active — The number of CIs currently operational and in use
- Critical — The number of CIs classified with a
Criticalcriticality rating - In Maintenance — The number of CIs currently undergoing scheduled maintenance
Note: Dashboard counts update in real time as CI records are created, updated, or change status.
CI List View
The CI List View displays all configuration items in a tabular format. Each row represents a single CI with the following columns:
| Column | Description |
|---|---|
| Name | The display name of the configuration item |
| Type | The CI category, such as Server, Database, or Network Device |
| Status | The current operational state of the CI |
| Criticality | The business impact rating: Critical, High, or Low |
| Owner | The individual or team responsible for the CI |
Available filters: Type, Status, Environment, Criticality
Actions:
- Add CI — Click the Add CI button to register a new configuration item
CI Types
Configuration items are classified by type to reflect the nature of the asset:
- Server — Physical or virtual server infrastructure
- Database — Database engines and managed database services
- Firewall — Network firewall appliances
- Load Balancer — Traffic distribution appliances and services
- Network Device — Routers, switches, access points, and other network hardware
- Cloud Resource — Cloud-hosted infrastructure and services
- Application — Software applications tracked as managed assets
- Container — Containerized workloads
- Workstation — End-user desktop or laptop computers
- Printer — Networked printers and multifunction devices
CI Statuses
Each CI is assigned an operational status, such as:
| Status | Description |
|---|---|
Active | CI is currently operational and in use |
In Maintenance | CI is undergoing scheduled maintenance |
Retired | CI has been decommissioned but is still tracked for history |
Environment Classification
Every CI is tagged with the deployment environment in which it operates. This classification supports environment-aware incident response and change control:
- Production — Systems serving live end-users or business operations
- Staging — Pre-production systems used for final validation before release
- Development — Systems used by engineering teams during active development
- Testing — Systems dedicated to quality assurance and automated test execution
Note: Environment tagging is required when creating a new CI. Untagged CIs may affect the accuracy of impact analysis during incidents and change planning.
Criticality Levels
Criticality ratings define the business impact of a CI and determine its priority during incident response, change planning, and maintenance scheduling:
- Critical — The CI is essential to core business operations. Outages have immediate and significant business impact.
- High — The CI supports important functions. Degradation affects productivity but does not halt operations.
- Low — The CI is non-critical. Loss or degradation has minimal impact on business continuity.
Managing CIs
Adding a New CI:
- Navigate to the CI List View
- Click the Add CI button
- Complete the CI fields, including Name, Type, Status, Criticality, and Owner
- Save the record. The new CI will appear in the list and be reflected in the Dashboard counts
Editing an Existing CI:
- Locate the CI in the list view or use filters to narrow results
- Click the CI name to open its detail record
- Update the relevant fields
- Save changes
Updating CI Status:
Status changes should be made promptly to maintain an accurate view of infrastructure health:
- Set a CI to
In Maintenancebefore starting scheduled maintenance windows - Set a CI to
Retiredwhen it is decommissioned but still tracked for history - Return a CI to
Activeonce maintenance or remediation is complete
Note: Changing a CI's status does not delete or archive its history. All previous status values are retained in the audit log.
Business Services
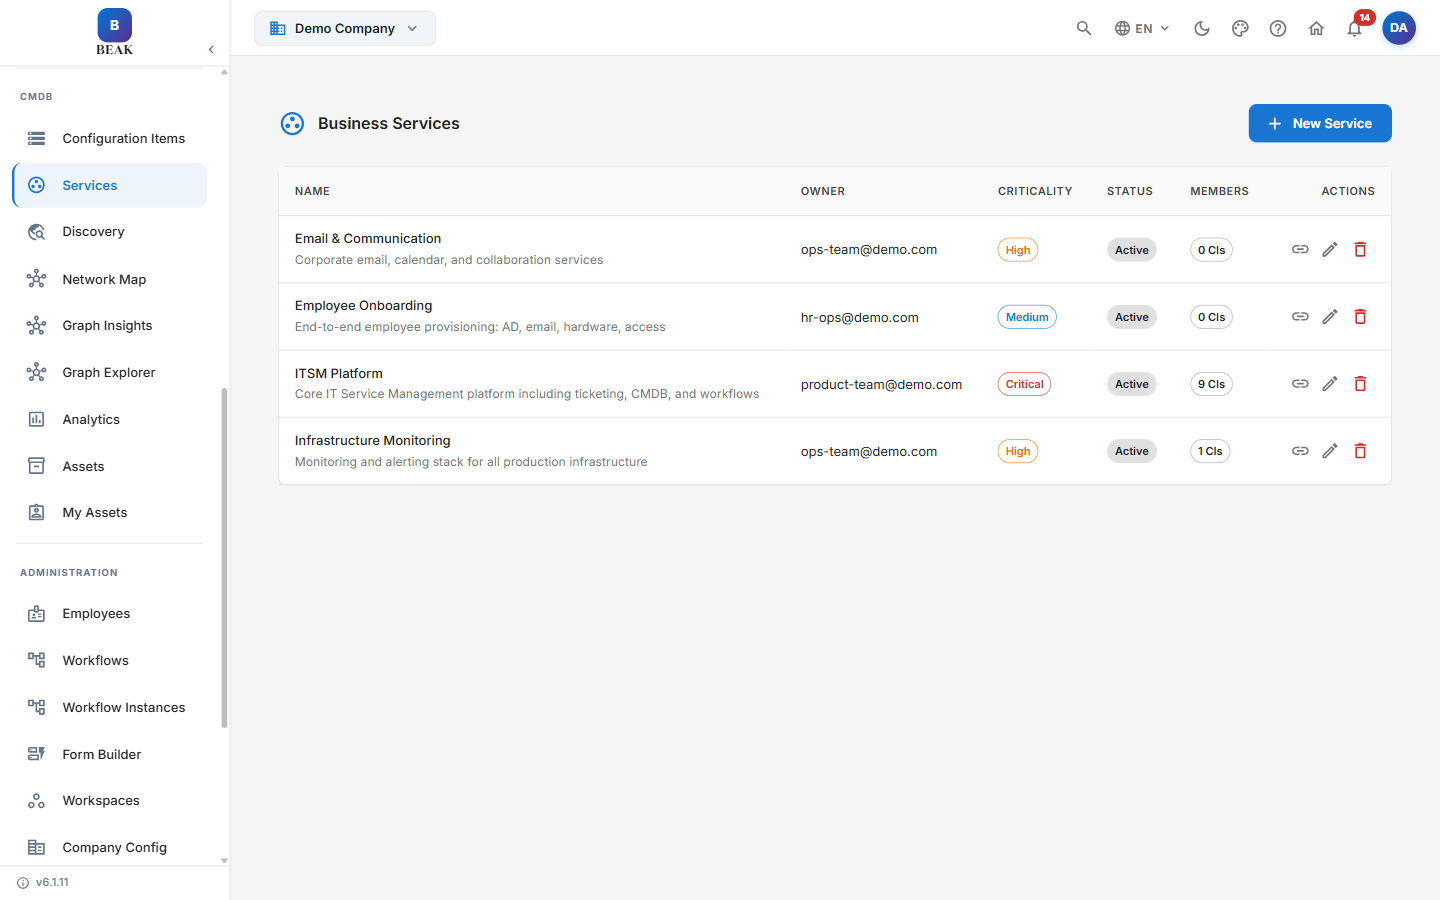
The Services section provides a catalog of IT and business services tracked in the CMDB. Each service record represents a logical service delivered to the organization, with associated ownership, status, and relationship to underlying CIs.
Service List View
The service list displays all registered business services. Each row shows the service name and a short description, with the following columns:
| Column | Description |
|---|---|
| Name | The display name of the business service, with a short description |
| Owner | The individual or team responsible for the service |
| Criticality | The business impact rating: Critical, High, or Medium |
| Status | The current operational state of the service, such as Active |
| Members | The count of CIs that are members of the service |
| Actions | Per-row actions for managing the service |
Actions:
- New Service — Click the New Service button to register a new business service
Note: Business services are linked to underlying CIs to map service dependencies. The Members column shows how many CIs belong to each service. When a CI supporting a business service experiences an incident, the service impact is immediately visible.
Discovery Management
Discovery Management automates the detection and registration of CIs in the CMDB. The page header reads Discovery Management — Manage network discovery jobs, credentials, and distributed collectors. It provides tools to schedule discovery scans, manage credentials for target systems, configure discovery collectors, and review discovery activity.
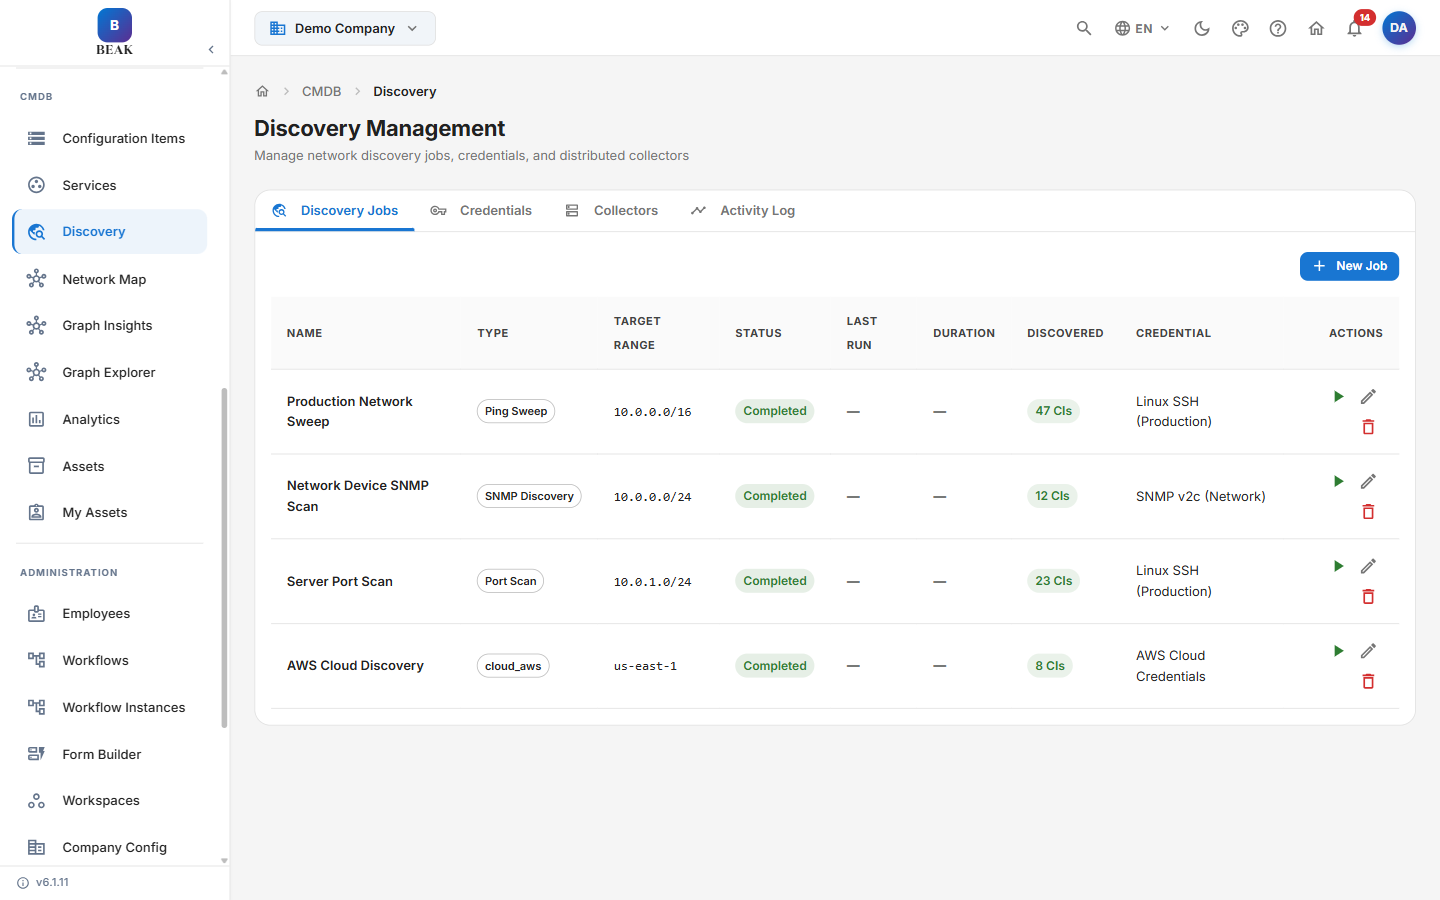
The Discovery section is organized into four tabs: Discovery Jobs, Credentials, Collectors, and Activity Log.
Discovery Jobs
The Discovery Jobs tab lists all configured discovery jobs. Each job is shown with the following columns:
| Column | Description |
|---|---|
| Name | Descriptive identifier for the discovery job |
| Type | The discovery method, such as Ping Sweep, SNMP Discovery, Port Scan, or AWS Cloud Discovery |
| Target Range | The scope of the scan (IP ranges, subnets, or cloud environments) |
| Status | The current state of the job |
| Last Run | Date and time the job last executed |
| Duration | How long the most recent run took |
| Discovered | Count of CIs discovered in the most recent run |
| Credential | The credential set the job uses to authenticate against targets |
| Actions | Per-row actions for managing the job |
Create new discovery jobs by clicking New Job and configuring the scan parameters.
Credentials
The Credentials tab manages authentication credentials used by discovery jobs to access target systems during scans. Credential sets seen in the live product include Linux SSH, SNMP v2c, and AWS Cloud Credentials.
Note: Credentials are stored securely and are never displayed in plain text after creation. Update credentials promptly when passwords or API keys are rotated.
Collectors
The Collectors tab manages the distributed collectors that execute discovery jobs. Each collector communicates discovery results back to the CMDB.
Activity Log
The Activity Log provides a chronological record of all discovery operations, including:
- Job executions with start and end times
- CIs created, updated, or removed by discovery
- Errors or warnings encountered during scans
- Credential validation results
Use the activity log to troubleshoot failed discovery jobs and verify that scans are completing as expected.
Network Map
The Network Map provides a visual topology view of all CIs and their relationships within the CMDB. It renders infrastructure as an interactive graph, showing how devices, servers, applications, and services are interconnected.
Key capabilities of the Network Map:
- Interactive graph visualization — CIs are displayed as nodes with connecting edges showing relationships and dependencies
- Node and edge counts — The map displays the total number of nodes (CIs) and edges (relationships) in the topology
- Zoom and pan — Navigate large topologies using zoom controls and click-drag panning
- Node selection — Click any node to view its CI details, such as type and status
- Filtering — Filter the map by Type and Status to focus on specific infrastructure segments
Note: The Network Map is populated from CI records and their defined relationships in the CMDB. For a complete topology, ensure CI relationships are maintained as infrastructure changes are made.
CMDB Analytics
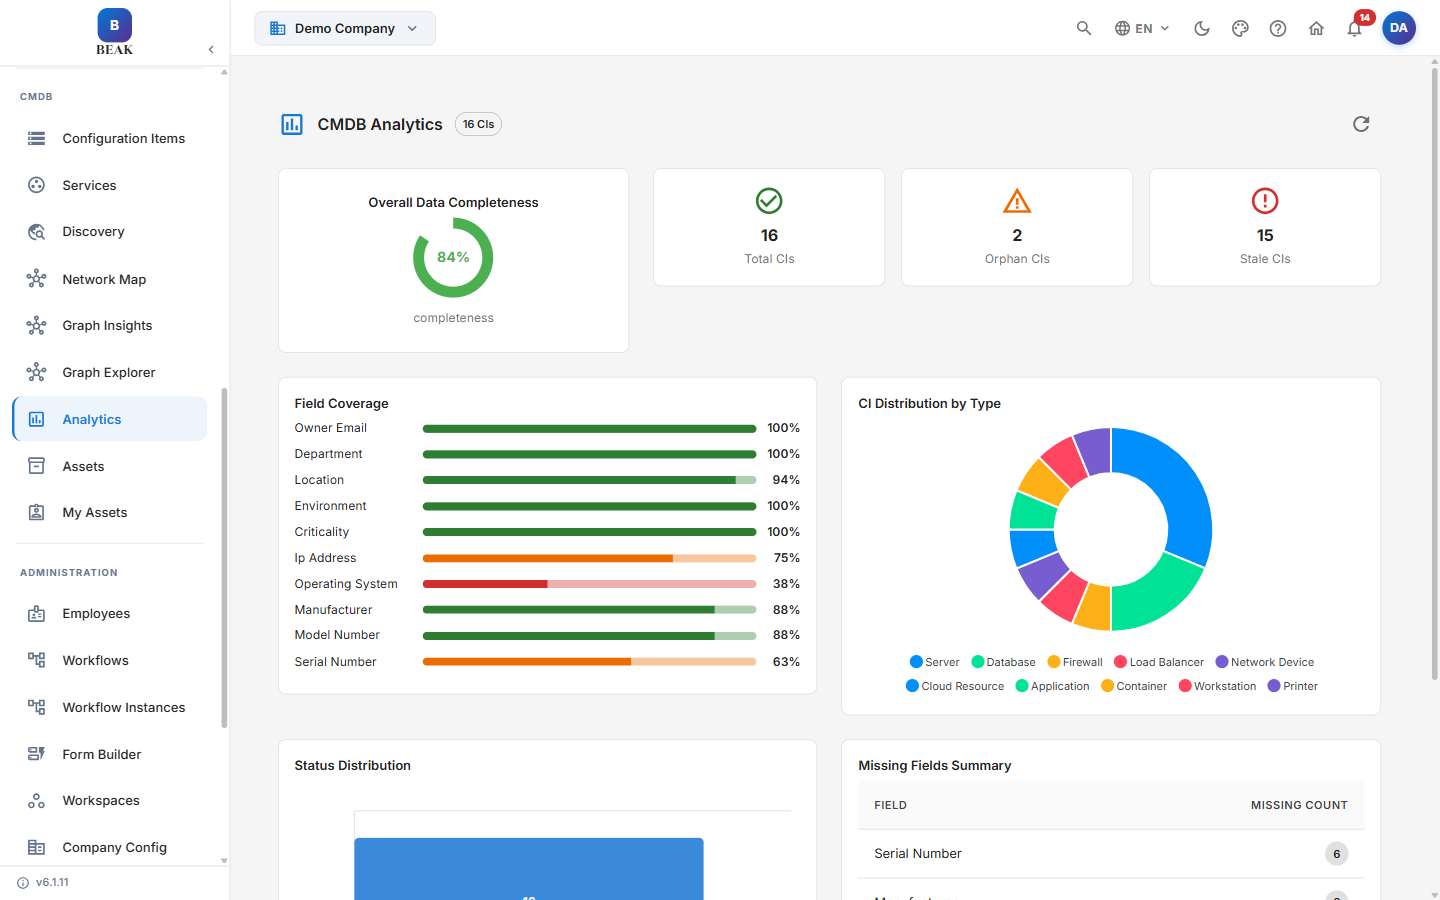
The Analytics section provides data quality and completeness metrics to help administrators maintain an accurate and reliable CMDB.
Data Completeness
The header presents four summary metrics:
- Overall Data Completeness — The percentage of CI fields populated across all records. A low score indicates that CI records are missing critical information.
- Total CIs — The total count of configuration items in the CMDB
- Orphan CIs — CIs with no defined relationships to other CIs or services
- Stale CIs — CIs that have not been updated within the expected freshness window
Field Coverage
Field coverage analysis breaks down completeness by individual field, showing the percentage of CI records that have each field populated. Tracked fields include:
- Owner Email
- Department
- Location
- Environment
- Criticality
- IP Address
- Operating System
- Manufacturer
- Model Number
- Serial Number
CI Distribution
The Analytics page provides visual breakdowns of CIs:
- CI Distribution by Type — Distribution of CIs across their CI types
- Status Distribution — Distribution of CIs across their statuses
Missing Fields Summary
The Missing Fields Summary table lists, for each field, the number of CI records where it is empty:
| Column | Description |
|---|---|
| Field | The CI attribute being measured |
| Missing Count | The number of CI records with this field empty |
Note: Review CMDB Analytics regularly to identify gaps in CI data. Incomplete records reduce the effectiveness of impact analysis during incidents and change planning.
Best Practices
- Maintain accurate ownership — Ensure every CI has an assigned owner to support incident routing and accountability
- Use consistent naming conventions — Apply a standardized naming scheme (for example,
HOSTNAME-ROLE-ENV) to make CIs easy to identify in lists and reports - Tag environments correctly — Never register a production CI as Development or Testing. Environment mismatch causes incorrect impact analysis
- Review Retired CIs regularly — Schedule periodic reviews to determine whether
RetiredCIs should be reactivated or formally removed from tracking - Set criticality based on business impact — Assess criticality from the perspective of business operations, not just technical function, to ensure incident prioritization is accurate
- Keep the CMDB synchronized with discovery — Run discovery jobs on a regular schedule and review the Activity Log to ensure new and decommissioned assets are reflected in the CMDB
- Monitor data completeness — Use CMDB Analytics to identify and remediate incomplete CI records before they affect incident response or change planning
- Map service dependencies — Link CIs to Business Services so that the impact of infrastructure changes or failures is immediately visible at the service level
Related Pages
- Incident Management — Identifying incidents affecting CIs and business services
- Change Management — Planning changes against CIs tracked in the CMDB
- Settings & Configuration — Configuring CI types, environments, and CMDB policies
- Reports & Analytics — CI-related metrics and data quality reports