Client Overview
Client Overview is an organization-wide analytics dashboard that aggregates service-management activity across every company in the platform — not just the company currently selected. It gives service providers and platform administrators a single, cross-client view of ticket volume, SLA performance, and workload distribution.
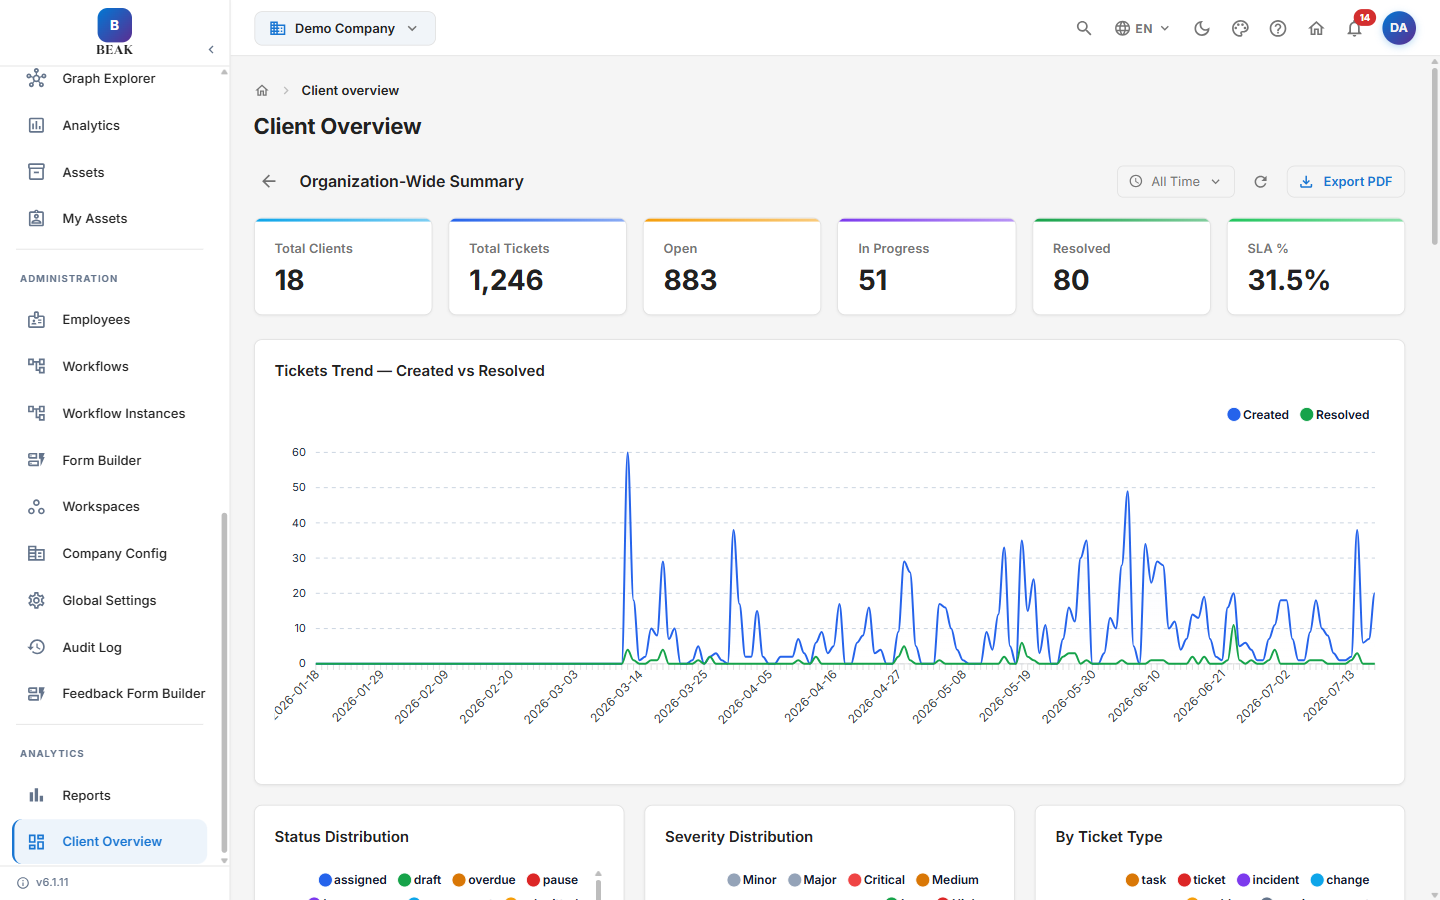
Note: The metrics on this page are aggregated across all clients and are independent of the company selector in the top bar.
Controls
- Time range — Scope every metric to a period (defaults to All Time)
- Refresh — Reload the dashboard with the latest data
- Export PDF — Download the organization-wide summary as a PDF report
Organization-Wide Summary
The headline cards summarize activity across all clients:
- Total Clients — Number of companies in the platform
- Total Tickets — All tickets across every client
- Open — Tickets in an open state
- In Progress — Tickets actively being worked
- Resolved — Tickets resolved in the period
- SLA % — Overall SLA compliance percentage
Trends & Distributions
- Tickets Trend — Created vs Resolved — Line chart comparing ticket creation against resolution over time
- Status Distribution — Breakdown of tickets by status across the full lifecycle
- Severity Distribution — Share of tickets by severity (
Critical,Major,Minor,High,Medium,Low) - By Ticket Type — Split across
task,ticket,incident,change,problem, andservice_request - Source Distribution — Where tickets originate (email, portal, Teams, AI agents, Beak Desk, and more)
- Open Tickets by Severity — Severity mix of currently open tickets
- Aging Distribution (Open Tickets) — Open tickets bucketed by age (
0–1d,1–3d,3–7d,7–30d,30d+)
Per-Company & Workload Breakdowns
- Tickets by Company — Ticket volume per client company
- SLA Compliance by Company — SLA compliance percentage per client company
- Top Categories — The most common ticket categories across all companies
- Top Assignee Groups — The busiest queues and assignee groups
Best Practices
- Use the time range for reporting cycles — Scope the dashboard to a month or quarter before exporting a PDF for stakeholder reviews.
- Watch the aging buckets — A growing
30d+segment signals a backlog that SLA percentages alone can mask. - Compare SLA by company — Use the per-company compliance chart to spot clients that need additional capacity or process attention.
Related Pages
- Reports & Analytics — Built-in operational and SLA reports
- Overview — The workspace-scoped ITSM dashboard