Reports & Analytics
The Reports module provides comprehensive analytics across all ITSM processes. A total of 18 built-in reports are organized across two tabs — General (11 reports) and Executive (7 reports) — to help teams track performance, identify bottlenecks, and measure service quality. Access Reports from the Analytics section of the left navigation panel within your BEAK ITSM instance.
For an org-wide, cross-client rollup dashboard, see Client Overview, which is documented separately.
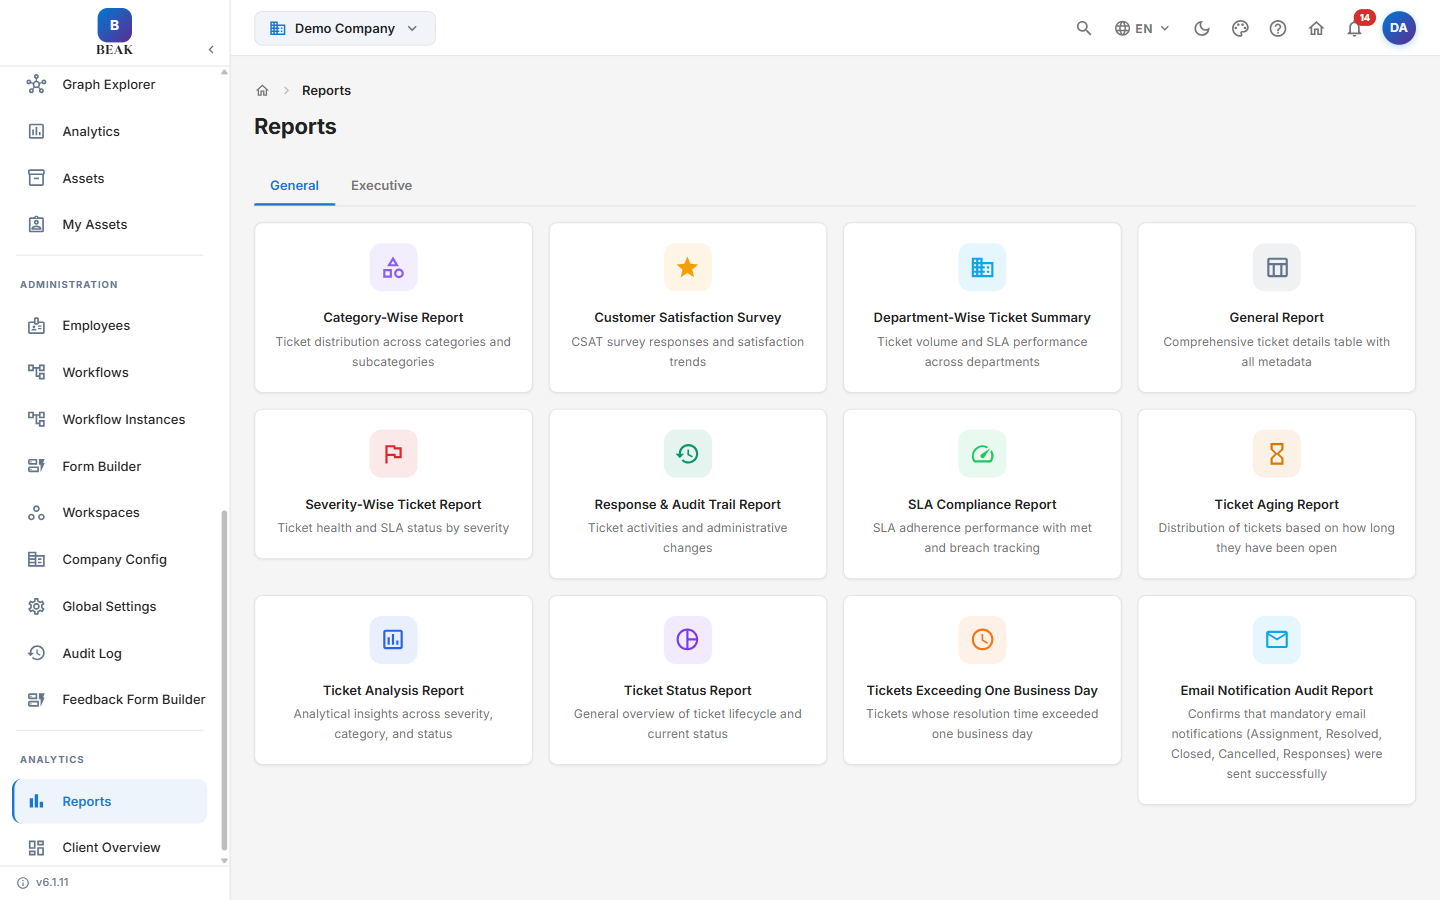
Report Tabs
Reports are organized into two tabs for quick navigation. Each report is a selectable card that opens its detailed report view.
- General — Operational reports covering ticket volume, categories, SLA compliance, aging, and satisfaction.
- Executive — Leadership-focused reports providing organization-wide overviews, SLA violations, and live service desk monitoring.
Available Reports
General
The General tab contains 11 reports:
| Report Name | Description |
|---|---|
| Category-Wise Report | Ticket distribution across categories and subcategories |
| Customer Satisfaction Survey | CSAT survey responses and satisfaction trends |
| Department-Wise Ticket Summary | Ticket volume and SLA performance across departments |
| General Report | Comprehensive ticket details table with all metadata |
| Severity-Wise Ticket Report | Ticket health and SLA status by severity |
| Response & Audit Trail Report | Ticket activities and administrative changes |
| SLA Compliance Report | SLA adherence performance with met and breach tracking |
| Ticket Aging Report | Distribution of tickets based on how long they have been open |
| Ticket Analysis Report | Analytical insights across severity, category, and status |
| Ticket Status Report | General overview of ticket lifecycle and current status |
| Tickets Exceeding One Business Day | Tickets whose resolution time exceeded one business day |
Executive
The Executive tab contains 7 reports:
| Report Name | Description |
|---|---|
| Customer Satisfaction Survey | CSAT survey responses and satisfaction trends |
| Executive Dashboard | Assets and tickets overview for senior leadership |
| Global Ticket Overview | Complete view of all tickets for volume tracking and analysis |
| Reassignment Report | Full reassignment history from initial to latest resolver |
| Service Desk Live Report | Real-time monitoring of service desk operations |
| SLA Violation Executive Report | All SLA breaches across the client with detailed analysis |
| Customer-Wise Report | Per-customer ticket volume, SLA, trends, and top categories (each workspace is a customer) |
Using Reports
- Navigate to Reports from the left navigation panel.
- Select the General or Executive tab to browse the reports in that group.
- Click a report card to open the detailed analytics view.
- Apply filters at the top of the report to scope the data:
- Date Range — Restrict the report to a specific time window.
- Workspace — Limit results to one or more workspaces.
- Additional dimension filters are available per report type.
- Each report displays a combination of charts, summary KPI tiles, and a detailed data table.
Note: Reports query live data and reflect the current state of your instance at the time of viewing. Scheduled report exports and email delivery are configured from Settings > Notifications.
Key Performance Indicators
The following KPIs are tracked across BEAK ITSM reports and dashboards:
- MTTR (Mean Time to Resolution) — The average elapsed time between ticket creation and resolution. A lower MTTR indicates a more efficient support operation. Tracked by priority, category, and agent.
- SLA Compliance % — The percentage of tickets resolved within their contracted SLA deadline. Calculated per workspace, priority, and category. The standard target is 95% or above.
- First Contact Resolution Rate — The percentage of tickets resolved during the initial interaction without requiring escalation or follow-up contact. A higher rate reduces ticket volume and improves user satisfaction.
- Ticket Backlog — The total count of open tickets that have not yet been resolved, segmented by age band (0–7 days, 8–14 days, 15–30 days, 30+ days). Growing backlog indicates capacity or routing issues.
- CSAT Score — Customer Satisfaction score derived from end-user feedback surveys sent upon ticket resolution. Scored on a 1–5 scale; the industry benchmark is 4.2 or above.