Incidents
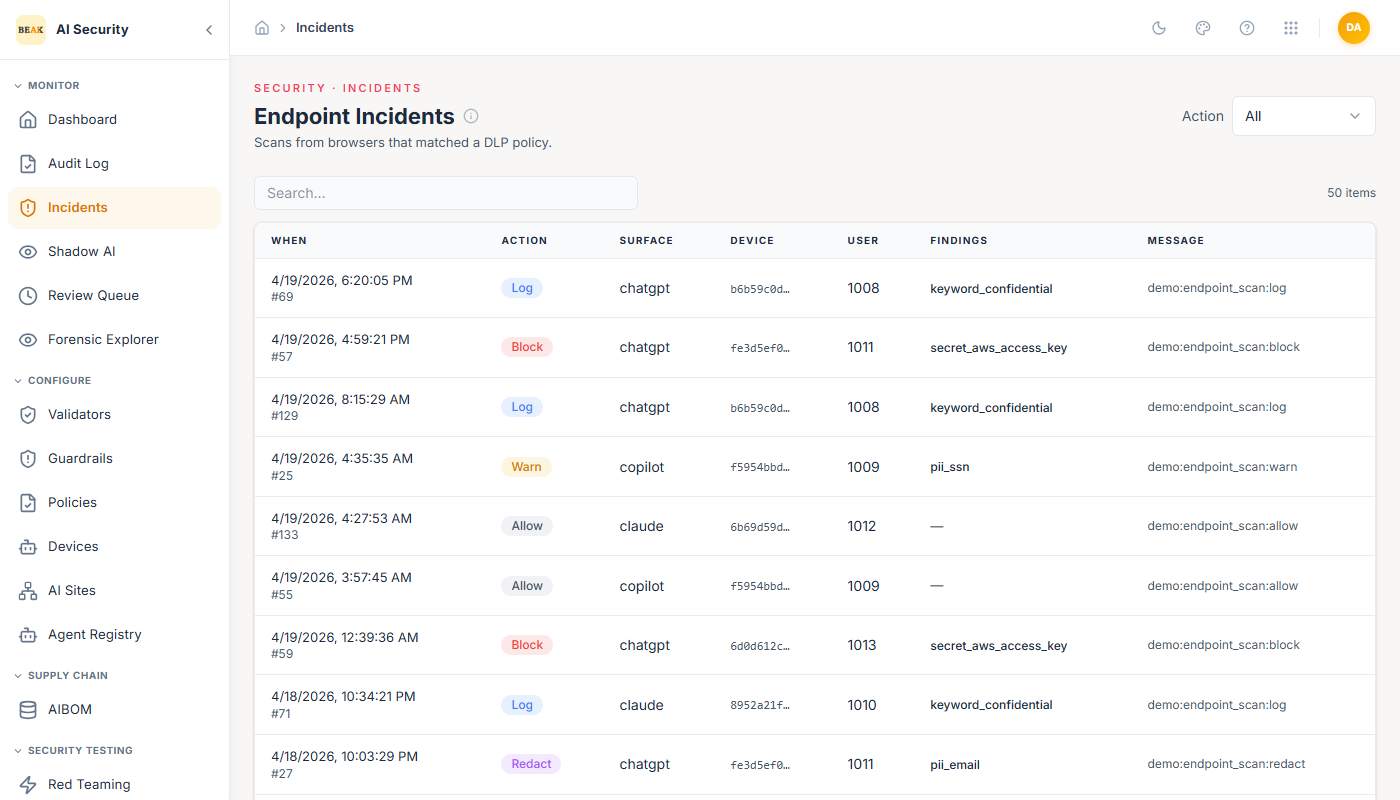
The Incidents page sits under the Security · Incidents eyebrow and is the triage queue for every request one of your policies acted on — whatever inspected it. Each row represents one decision by the rule engine: when it happened, what inspected the traffic, which policy fired, what the engine did, and what the scanners found.
Four paths submit traffic to the same rule engine and all four appear here: the browser extension on a managed device, Microsoft Copilot Studio agents, Anthropic inference hooks, and the moderation API used by agent runtimes. Every incident carries the full forensic chain metadata — content hash, chain index, and previous-hash pointer — so the record is tamper-evident and suitable for regulatory evidence. Clicking any row opens a side panel with the complete detail.
Note: An incident is a policy hit, not a traffic log. Clean requests that no policy acted on are excluded, so the row count reflects what your policies stopped rather than how much traffic passed through. Turn on
Include allowedto widen the list, or use the Audit Log for the complete audit trail.
Origin and the source of an incident
Incidents are grouped along two dimensions. Origin is the coarse one, and it is how most triage starts:
- Endpoint — A person at a managed device. The Beak browser extension scanned what they were about to submit to an AI site.
- Agent — A model or agent calling in. Covers Microsoft Copilot Studio tool calls, Anthropic inference hooks, and the moderation API.
Detected by is the specific integration within that origin:
- Browser extension — A scan from a paired device, carrying the AI site and the device identity.
- Microsoft Copilot Studio — A tool call evaluated before Copilot Studio was allowed to run it.
- Anthropic — A prompt held by Anthropic while Beak returned an allow or deny verdict.
- API — A call to the moderation API, typically from an agent runtime.
- Red team and Evaluation — Simulated traffic from the red-team and evaluation suites.
Note: A source that this console has not been taught yet is grouped under
Agentrather than left blank, so a newly added integration appears in the queue without any configuration.
Filters and controls
Search, the filters and the time range are all resolved by the server across every incident in range, not just the rows on the current page — so a search returns matches from page forty as readily as page one.
- Search — Free text over the inspected content, the verdict, the policy name, the surface, the agent identity, and the recorded metadata (including a Copilot tool name and its arguments).
- Origin — Narrows to
EndpointorAgent. - Detected by — Narrows to a single integration.
- Action — Narrows to one rule-engine decision:
Blocked,Would block (shadow),Redacted,Warned, orLogged only. - Include allowed — Adds the requests no policy acted on. Off by default.
- Time range — Bounds the window; defaults to the last seven days.
- Refresh interval — Re-runs the query on a chosen cadence, or off.
- Columns — Shows or hides columns; the selection is remembered per user.
- Export — Writes CSV or PDF of every incident matching the current filters, not just the visible page.
Incidents table
The table lists incidents in reverse chronological order and pages through the full filtered set. The item count above the table is the server's total for the current filters.
- When — Timestamp of the decision in the browser's local timezone.
- Action — A colour-coded badge for the rule-engine decision:
Allow(neutral),Log(grey),WarnandRedact(amber),Would block(amber),Block(red). - Origin —
EndpointorAgent. - Detected by — The integration that inspected the traffic.
- Policy — The name of the policy that fired.
- Who — The agent identity for agent traffic, or the tenant user for endpoint traffic.
- Where — The surface the traffic was seen on — an AI site such as
chatgpt.comfor a browser scan, or the calling application for an agent — with a shortened device identifier appended when the incident came from a paired device. - What was found — Up to three finding categories detected by the scanners, with a count of the remainder.
Note:
Would blockis a shadow-mode verdict. The rule engine computed a block and it was not applied, because the tenant is still tuning the policy. Reviewing these is how you confirm a policy is ready to enforce.
Incident detail panel
Clicking any row opens a side panel titled Incident #<chain-index> with the action badge and the absolute and relative timestamps in the header.
Context
- Origin —
EndpointorAgent. - Detected by — The integration that inspected the traffic.
- Surface — The AI site or calling application, when one distinct from the integration was recorded.
- Agent ID — The agent the traffic belonged to, when recorded.
- User — The tenant user ID.
- Device — The full device UUID, for endpoint incidents.
- Event type — The event category as recorded by the submitting pipeline.
Decision
- Action — The badge-styled action the rule engine took.
- Policy — The name of the policy that fired.
- Sent to Anthropic — For an Anthropic incident, the verdict actually returned on the wire. This can differ from the action: a policy that asked for redaction cannot be honoured by a protocol that has no way to return rewritten text, so it resolves to an allow or a deny according to the tenant's setting.
- Fired rules — The rule IDs that contributed to the decision.
- Reason — The message explaining why the action was taken.
Request details
The specifics of the request, which differ by integration. A Copilot Studio incident shows the tool that was called, its arguments, the agent's stated intent, the conversation, and the Power Platform environment. An Anthropic incident shows the model, the actor, and the session. Shared engine detail — the highest severity found, the categories matched, and the validators that objected — appears for every source.
Findings
One card per finding recorded by the scanner, showing a severity badge (critical, high, medium, or low), the finding category, the scanner type that detected it, a confidence score, the character span within the inspected text, the matched snippet, and the associated rule ID.
Redactions
Present when the action was redact. Lists each redacted span with its character range and the category of the redacted content.
Inspected text
When available, the first 1 000 characters of the content that was submitted for inspection, in a scrollable monospace block.
External systems
Where this incident was mirrored, and how to open it there. Each configured integration is listed with its status — Created, Forwarded, Queued, Failed, or Gave up — and any error it reported.
- Microsoft Defender XDR — Creates one alert per incident and returns its identifier, so this entry carries an
Open in Defender XDRlink straight to the alert. The alert ID is shown alongside the link, because a sovereign-cloud tenant reaches the portal on a different host. - Microsoft Sentinel — Audit rows are forwarded in batches into a Log Analytics custom table. Status is
Forwardedonce this incident is behind the tenant's forwarding watermark, andQueueduntil then. - Microsoft Teams — Posts to a channel webhook. Delivery status only.
Note: Sentinel has no per-incident link, and this is a limitation of the ingestion API rather than an omission — a batched write to Log Analytics returns no per-row identifier. Instead, the panel shows a ready-to-run KQL query under
Find it in Logsthat locates this exact incident in the custom table. Paste it into Sentinel → Logs.
When the panel reports that no external integration is configured, that is a statement about the tenant, not about the incident: nothing is set up to mirror to. Configure integrations in Integrations.
Forensic chain
- Chain index — The sequential position of this event in the tenant's audit chain.
- Schema version — The payload schema version used when the event was recorded.
- Content hash — SHA-256 hash of the event payload.
- Previous hash — Hash of the preceding event, linking this record to its predecessor.
Permissions
Reading this page requires the incidents:read permission, which is included in every built-in role that carries read access. A custom role needs it explicitly to open the page and its detail panel.
Best Practices
- Filter by
Originbefore anything else — Endpoint and agent incidents are handled by different people and resolved in different ways: an endpoint block is a conversation with a user, while an agent block is a change to a prompt, a tool, or a policy. - Review
Would blockbefore enforcing a policy — Shadow-mode verdicts show what a policy would have stopped without stopping it, so working through them is how you find false positives before they reach users. - Search by policy name to measure one control — Because search covers the policy name, typing it returns every incident that policy has caused across all four sources, which answers "is this rule doing anything" in one query.
- Check
External systemswhen an incident should be in your SIEM — AFailedorGave upstatus means the integration needs attention in Integrations, and aQueuedSentinel status that never advances means the forwarder is not draining. - Export with filters applied for evidence — CSV and PDF exports cover every incident matching the current filters rather than the visible page, so an export made from a filtered view is a complete record of that question.
- Preserve the forensic chain for compliance — The chain index, content hash, and previous hash provide a cryptographic proof-of-integrity trail; reference these fields when preparing regulatory evidence.
Related Pages
- Overview — High-level product overview for Beak AI Security.
- Audit Log — The complete hash-chained ledger, including the requests no policy acted on.
- Shadow AI — Aggregated usage report summarising block, warn, and redaction counts per AI service.
- Devices — Manage the paired devices that generate endpoint scan events.
- AI Sites — Configure which AI services the extension detects and their sanctioned status.
- Integrations — Configure the Defender XDR, Teams, and Sentinel integrations that receive mirrored incident data.