Audit Log
The Audit Log — referred to in the product as the Execution Ledger — records every AI moderation event in a tamper-proof, blockchain-style hash chain. Each event is linked to the previous one via a cryptographic content hash, making retroactive modification detectable. The ledger is the authoritative record for compliance reporting, incident investigation, and regulatory audits.
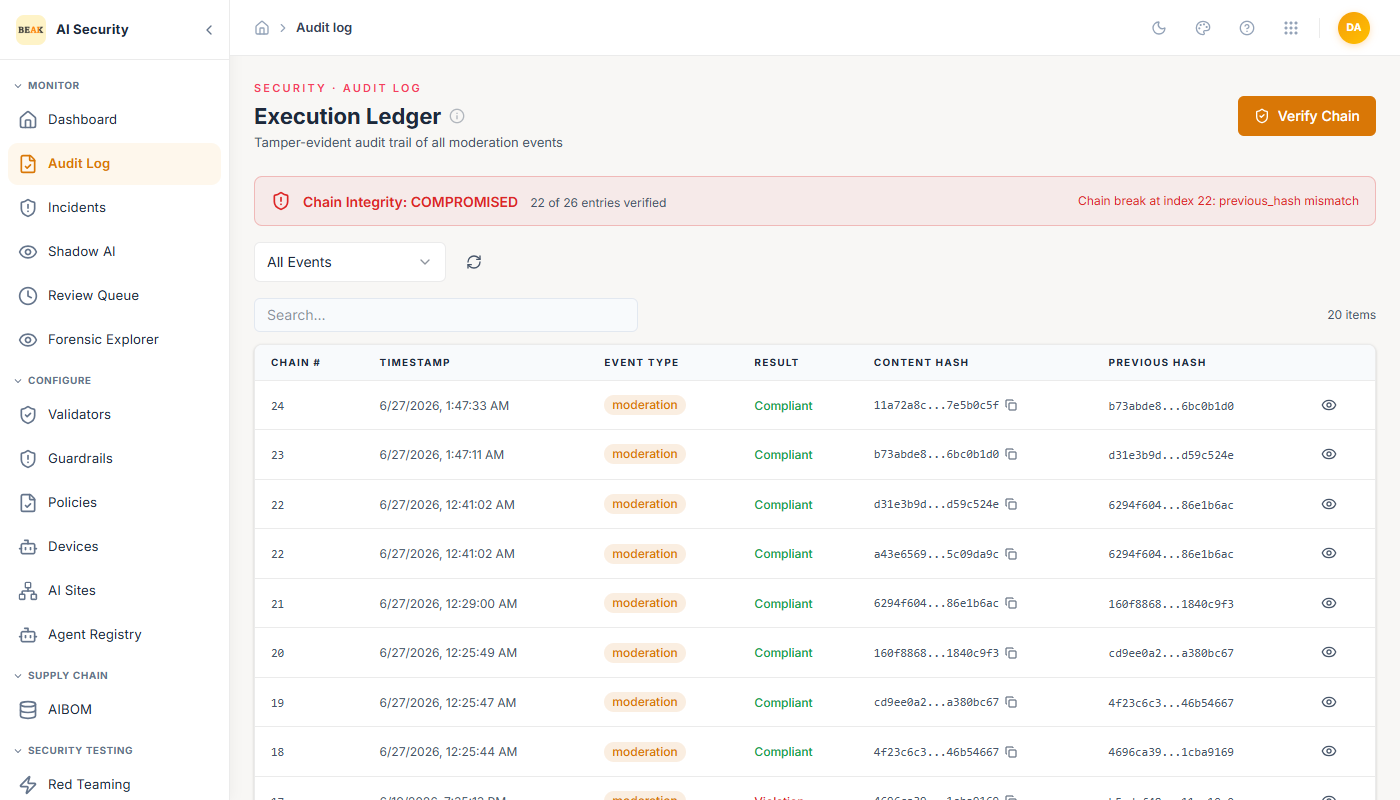
Chain Integrity
A Chain Integrity status bar at the top of the page shows how many events have been verified against the hash chain. A verified status (e.g., 248/248) means no tampering has been detected across all records. The Verify Chain button on the right triggers a full re-verification on demand.
Note: Chain verification can be run at any time. A verified count lower than the total means verification stopped at that point, and there are two quite different reasons for it. One is tampering. The other is a historical break — for example two events that were once written to the same position in the chain, which older releases could produce under load and which no longer happens. Read the reported index and reason before concluding which you are looking at: a break inside a range of long-settled history is a different situation from one that appears at the head of the ledger.
Event List
Each row in the ledger represents one moderation event. The columns are:
-
Chain # — Sequential index of the event in the ledger. Events are numbered starting from 1.
-
Timestamp — Exact date and time the event was processed.
-
Event Type — The category of the event (e.g.,
moderation). -
Result — The enforcement outcome:
Compliant(green) orViolation(red). -
Content Hash — Truncated SHA hash of the event payload, with a copy button for the full hash.
-
Previous Hash — Hash of the immediately preceding event, forming the chain link.
-
Mode — How the agent was acting when the decision was made: Unattended for a run with no human present, or OBO ("on behalf of") for one carried out under a person's delegated authority. An unattended row also shows what triggered it — a schedule, a webhook, an inbound peer. A dash means the caller declared no mode.
The list can be filtered by event type, by mode, and searched by free text. Every filter is applied across the whole ledger, not just the page on screen.
Unattended vs delegated decisions
The mode dropdown splits the ledger by whose authority the agent was using:
- Unattended (autonomous) — nobody was watching. A schedule fired, a webhook arrived, or a peer called in. This is the view to open first during an incident review: it answers "what did agents do while no one was present", which is the question the rest of the ledger cannot isolate.
- On behalf of a human (OBO) — the agent was acting with a named person's delegated authority, and that person is accountable for it.
The mode is declared when the agent's credential is issued, never guessed from the shape of the request. That matters for evidence: a guessed mode could be re-derived differently later, whereas a declared one is a claim someone made at the time.
It is also inside the hash chain. Re-attributing an unattended decision as an interactive one — or re-pointing it at a different agent — changes the content hash and breaks verification for every event after it. The same is true of the trigger.
Note: Mode and trigger are independent. An agent can act unattended and under a person's delegated authority — a scheduled job running with a user's authority is a real shape, not a contradiction — so a row may show OBO and still carry a trigger.
Decisions that were never inspected
Content inspection is deliberately fail-open: if the policy store cannot be reached, the request proceeds rather than every agent in the tenant stopping. What must not happen is that it proceeds silently — on the wire such a decision looks identical to a clean pass, and identical to a tenant that has no policies at all.
The Uninspected only toggle narrows the ledger to those decisions. Agent Governance shows the same figure as a running count, so it is visible without going looking for it.
Warning: These rows are recorded as allowed and compliant, because the request was not blocked. That is not the same as having been checked. No guardrail was applied to that traffic, and it is worth understanding why inspection was unavailable.
The toggle composes with every other filter, so "unattended and uninspected" is one question rather than two.
Event Detail
Clicking the eye icon on any row opens a detail modal containing the complete record:
- Event metadata — Type, chain index, timestamp, and result.
- Full hashes — Complete content hash and previous hash (copyable).
- Input Data — The raw input that was submitted to the AI agent.
- Validator Results — Full JSON output from every validator that evaluated the event, including pass/fail status and reason text for each.
This detail view provides the complete evidence trail needed for incident reports or compliance evidence packages.
Best Practices
- Run Verify Chain before generating compliance reports to confirm ledger integrity.
- Export audit records periodically and store them in your SIEM or compliance archive.
- Use the Result filter to isolate violations and investigate them in the Forensic Explorer.
- For high-volume environments, use the search bar to filter by specific agent IDs or time windows.