Threat Dashboard
The Threat Dashboard provides real-time visibility into live threats and the status of runtime protection controls. While the Audit Log is the retrospective record of all events, the Threat Dashboard is the live view — showing what is happening right now and confirming that your protection controls are active.
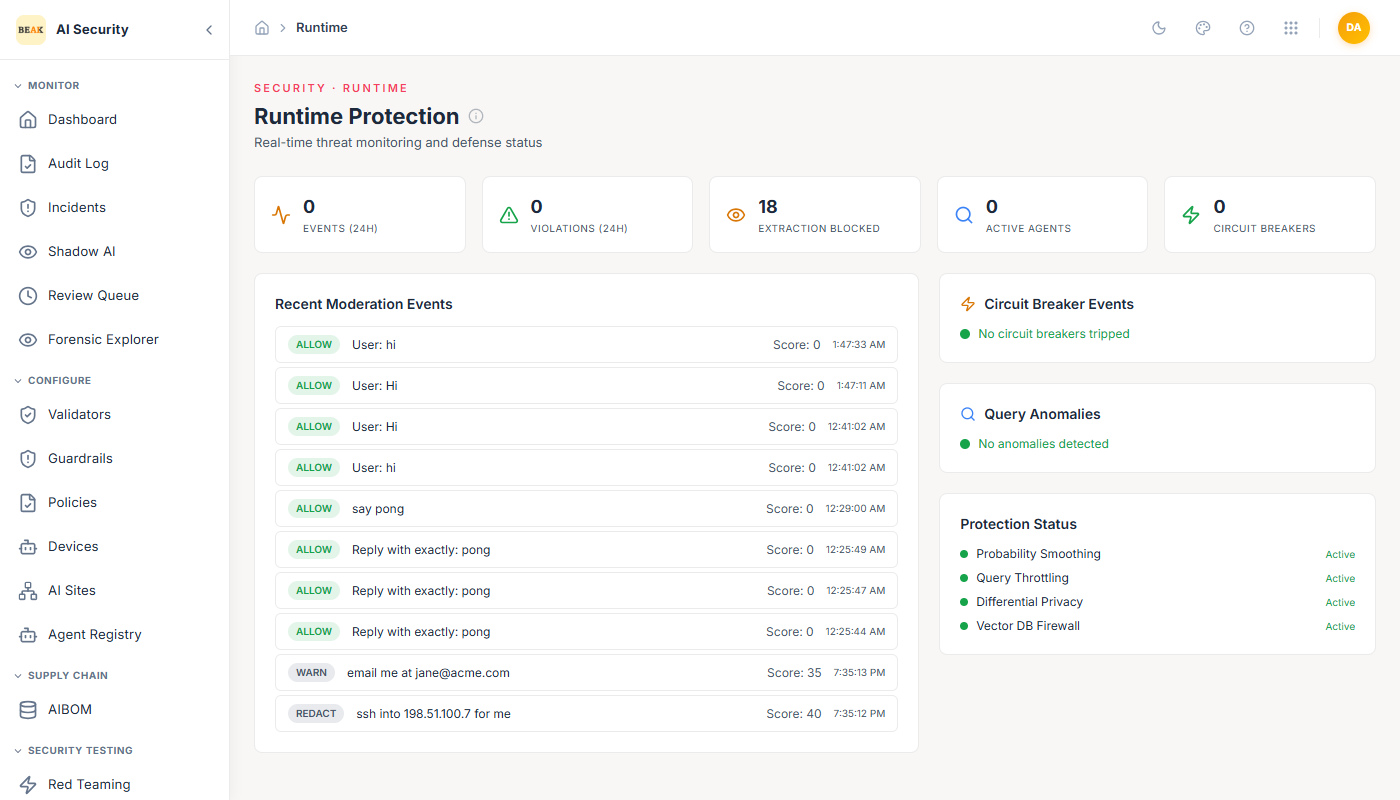
Runtime Metrics
The top of the page shows key metrics for the current monitoring window:
- Events (24h) — The number of moderation events processed in the last 24 hours.
- Violations (24h) — The number of those events that resulted in a violation.
- Extraction Blocked — Cumulative count of extraction attempts that have been blocked by runtime controls. This counter persists across time windows.
- Active Agents — The number of agents currently running and submitting events.
- Circuit Breakers — The number of circuit breakers currently tripped. A value of 0 means all agents are operating normally.
Recent Moderation Events
The left panel shows a live feed of the most recent AI interactions as they are processed. Each event in the feed shows:
- Prompt snippet — A preview of the input text that was submitted to the agent.
- Outcome —
Allow(green) orReview(orange). Blocked events appear with their violation label. - Risk Score — The numeric risk score assigned to this interaction.
- Timestamp — When the event was processed.
This feed updates as new interactions arrive, giving the SecOps team a live view of agent activity without having to reload the page.
Protection Controls
The right panel shows the status of four runtime protection mechanisms. All should show Active under normal operation:
-
Probability Smoothing — Reduces susceptibility to adversarial prompt perturbations by smoothing the probability distribution over model outputs. Helps defend against evasion techniques that exploit small input variations.
-
Query Throttling — Rate-limits the number of queries an agent or external caller can submit in a time window. Prevents automated probing and brute-force extraction attempts.
-
Differential Privacy — Applies differential privacy noise to sensitive query responses to prevent statistical inference attacks against the underlying model or training data.
-
Vector DB Firewall — Intercepts and validates all queries against vector databases (used for RAG and knowledge retrieval) to prevent embedding inversion and retrieval poisoning attacks.
Note: If any protection control shows as inactive, investigate immediately. A disabled control means that class of runtime attack is unmitigated.
Circuit Breaker Events
The circuit breaker panel shows any agents that have been automatically suspended due to anomalous behavior. A circuit breaker trips when an agent exceeds its configured risk threshold repeatedly or generates an unusual pattern of violations within a short time window. A tripped circuit breaker suspends the agent until it is manually reviewed and reset.
Query Anomalies
The query anomalies panel highlights statistical outliers in query patterns — for example, a sudden spike in queries from a specific agent or an unusual distribution of input lengths. These are early warning signals for probing or exfiltration attempts that haven't yet triggered a hard violation.
Best Practices
- Keep the Threat Dashboard open during active deployments or high-risk periods such as penetration tests or after a new agent launch.
- If the Circuit Breakers count rises above 0, investigate the tripped agent in the Agent Registry and review its recent sessions in the Forensic Explorer.
- Monitor the Extraction Blocked counter for unusual spikes — a large jump may indicate a coordinated extraction campaign.
- Review any Query Anomalies in conjunction with recent Red Teaming campaigns to determine whether anomalies are from your own testing or from external probing.