Location Analytics
Location Analytics provides geographic and organizational breakdowns of your Microsoft 365 license estate — enabling administrators to identify regional cost concentrations, underutilized departments, and allocation imbalances across countries, cities, and departments.
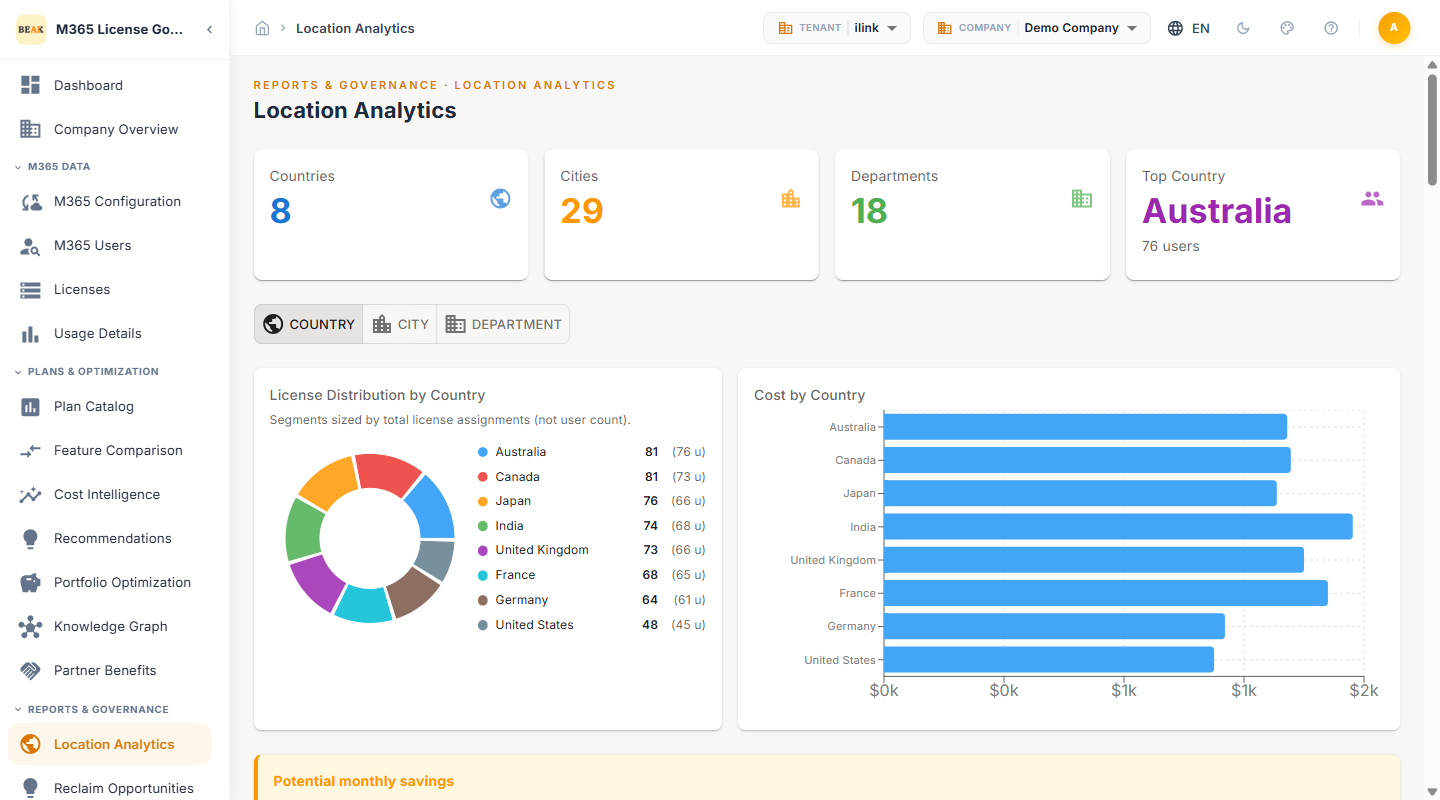
KPI Cards
Four summary cards are displayed at the top of the Location Analytics page, providing an at-a-glance view of organizational distribution:
- Countries — Total number of distinct countries with assigned licenses
- Cities — Total number of distinct cities with assigned licenses
- Departments — Total number of distinct departments with assigned licenses
- Top Country — The country with the highest user count, highlighted in the card with its total user figure
Note: Users without a populated country field in Azure AD are grouped under the
Unknowncategory. Improving directory data quality will enhance the accuracy of location-based analytics.
Navigation Tabs
Location Analytics is organized into three tabs, each providing the same analytical views scoped to a different organizational dimension:
- COUNTRY — Aggregates license data by the country attribute from the user's Azure AD profile
- CITY — Aggregates license data by the city attribute from the user's Azure AD profile
- DEPARTMENT — Aggregates license data by the department attribute from the user's Azure AD profile
Each tab displays the same set of charts and tables, recalculated for the selected dimension.
License Distribution Chart
The License Distribution by Country donut chart visualizes the proportional breakdown of license assignments across geographic regions. Each segment represents a country with its corresponding license count.
Note: If users lack a populated country field in Azure AD, they are grouped under the
Unknowncategory. Standardizing Azure AD attributes eliminates this grouping and produces accurate geographic breakdowns.
Cost by Country Chart
The Cost by Country horizontal bar chart ranks each country by its total monthly license expenditure. Bars are displayed in descending order, with the highest-cost country at the top — providing immediate visibility into where license spend is concentrated.
Key use cases:
- Identify cost-heavy regions — Determine which countries account for the largest share of M365 spend
- Validate allocation efficiency — Compare cost distribution against headcount or business revenue contribution
- Support chargeback models — Use cost-by-country data to allocate license expenses to regional business units
Utilization Rate by Country Chart
The Utilization Rate by Country bar chart displays the percentage of assigned licenses actively in use for each country. This metric highlights regions where licenses are underutilized and optimization recommendations may yield the highest savings.
- High utilization (above 90%) — Indicates licenses are well-matched to active usage
- Low utilization (below 70%) — Signals potential for license removal or downgrade recommendations
- Zero utilization — May indicate onboarding delays, inactive accounts, or directory data issues
City and Department Views
When switching to the CITY or DEPARTMENT tabs, the same chart types are rendered using city-level or department-level aggregation:
- License Distribution by City / Department — Donut chart showing proportional license counts
- Cost by City / Department — Horizontal bar chart ranking monthly spend
- Utilization Rate by City / Department — Bar chart comparing active usage percentages
These views enable department-level chargeback analysis and city-level capacity planning.
Best Practices
- Standardize Azure AD attributes — Ensure Country, City, and Department fields are consistently populated across all user accounts to eliminate
Unknowngroupings and duplicate entries - Use department analytics for chargeback — Allocate license costs to business units based on department-level spend data
- Monitor low-utilization regions — Prioritize optimization recommendations for countries or departments with utilization rates below 70%
- Review quarterly — Location analytics should be reviewed at least quarterly to track the impact of organizational changes, hiring, and offboarding on license distribution
- Combine with Recommendations — Cross-reference location data with the Recommendations module to target optimization efforts by region