Dashboard Overview
The Beak M365 License Optimizer Dashboard is the central command view for your Microsoft 365 license estate. It surfaces real-time KPIs, compliance warnings, optimization recommendations, and cost analytics — giving license administrators immediate visibility into spend, utilization, and savings opportunities across all tenants.
Global Search
The global search bar at the top of the dashboard enables quick lookup of users, licenses, SKUs, and recommendations across the entire platform. Type a user name, email address, or license SKU to navigate directly to the relevant detail view.
KPI Cards
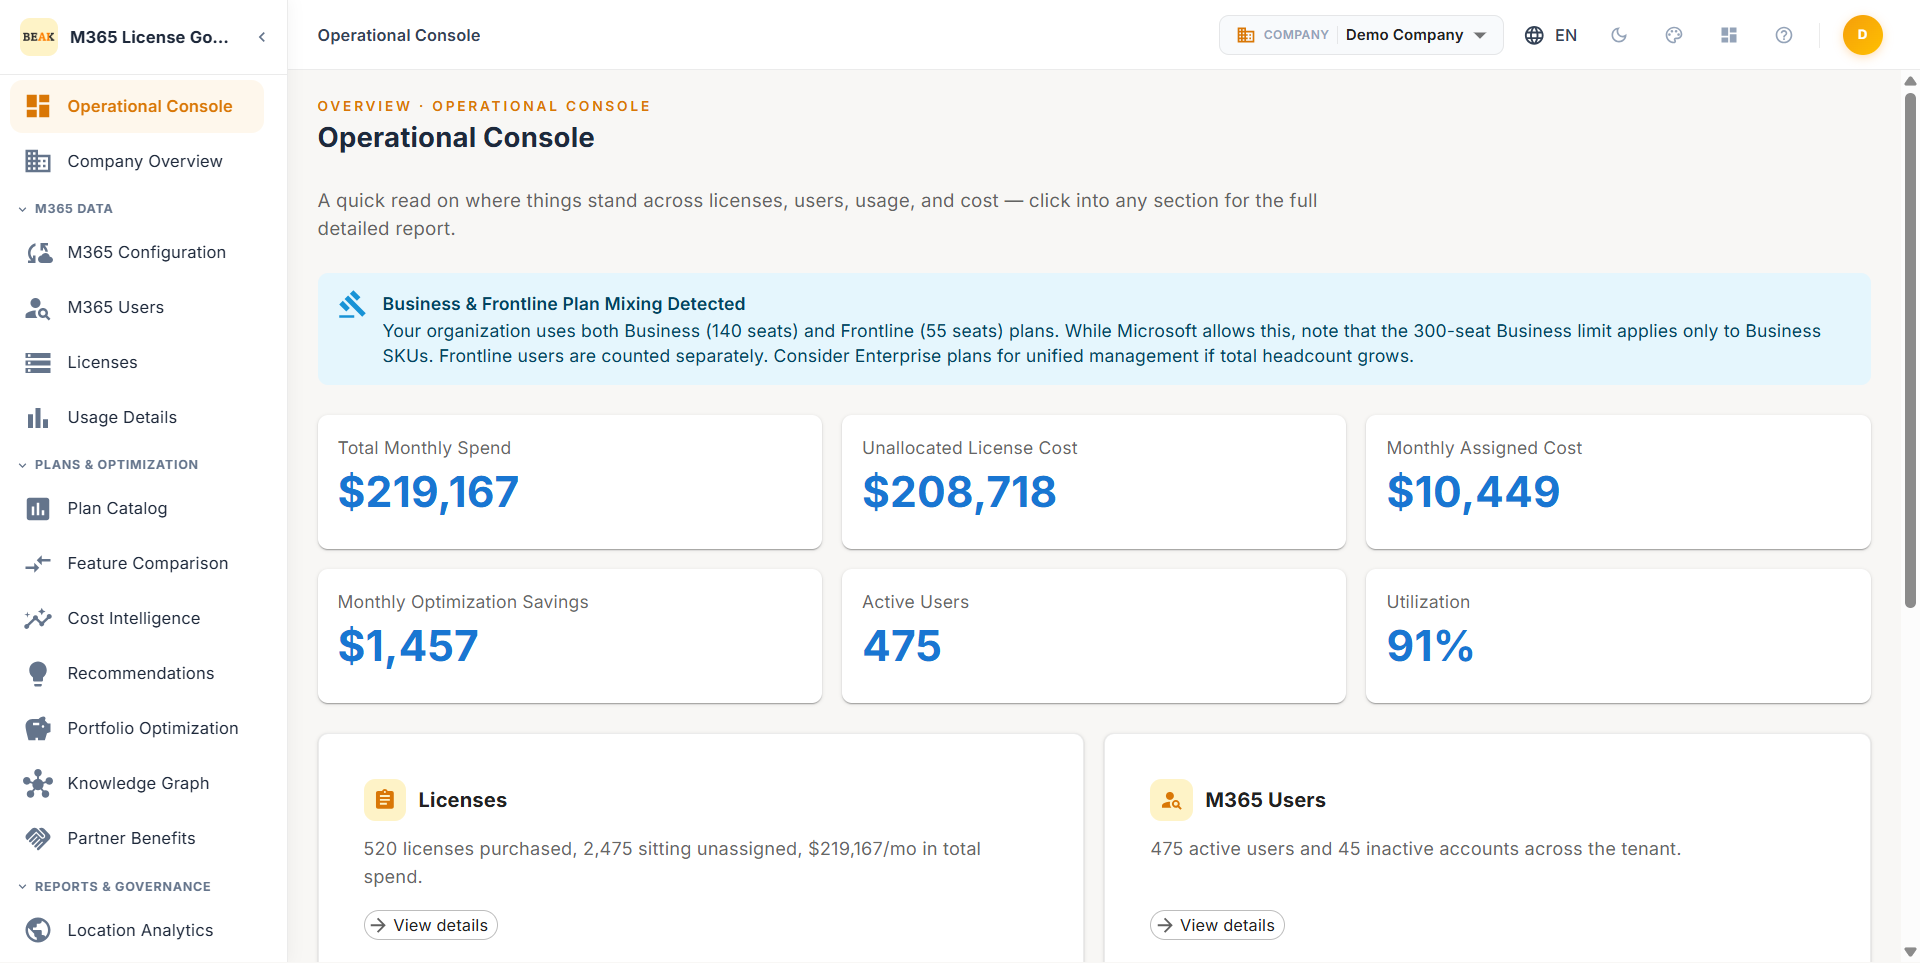
Five KPI cards span the top of the dashboard, providing at-a-glance metrics for the entire M365 estate.
- Total Licenses — The total number of M365 licenses across all active subscriptions. A sub-label shows how many of those seats are currently unallocated (sitting in the available pool).
- Active Users — The count of users who have actively consumed at least one licensed M365 service within the reporting period. A sub-label shows the inactive user count alongside the active figure.
- Monthly Assigned Cost — The current total monthly expenditure across all assigned M365 license seats, calculated from per-seat pricing and assigned seat counts.
- Monthly Optimization Savings — The estimated monthly savings achievable by implementing all pending optimization recommendations. Shown as both an absolute dollar amount and as a percentage of current spend.
- Utilization — The overall license utilization rate, representing the percentage of allocated licenses that are actively consumed by users.
Business License Limit Warning
When any Microsoft 365 Business plan exceeds its maximum seat limit of 300 users, the dashboard displays a prominent compliance warning banner.
- Warning Condition — Business plan licenses exceed the 300-seat limit
- Required Action — Affected users must be migrated from Business plans to Enterprise plans to remain compliant with Microsoft licensing terms
- Risk — Microsoft may enforce the seat cap at renewal, blocking new assignments or triggering automatic plan conversion
Note: Business plans (Microsoft 365 Business Basic, Business Standard, Business Premium) are limited to 300 seats per tenant. Organizations exceeding this threshold should proactively migrate users to equivalent Enterprise SKUs (E1, E3, E5) to avoid disruption.
Optimization Insights
The Optimization Insights section summarizes all pending recommendations with their aggregate cost impact. The header displays the total recommendation count and total potential monthly savings.
Recommendation Cards
Three cards break down the recommendations by action type:
- Downgrades — Users identified for license downgrade to a lower-cost plan that still covers their actual usage. These users are assigned premium SKUs (e.g., E5, E3) but only consume features available in lower-tier plans.
- Removals — Users identified for license removal due to inactivity or redundancy. Includes inactive accounts, departed employees, and automation or application mailboxes that do not require paid licenses.
- Upgrades — Users identified for license upgrade to a higher-tier plan that includes services they are currently consuming through add-on licenses.
Note: Clicking any recommendation card navigates to the full Recommendations list filtered by that action type, where administrators can review individual user details and approve or dismiss each suggestion.
License Distribution
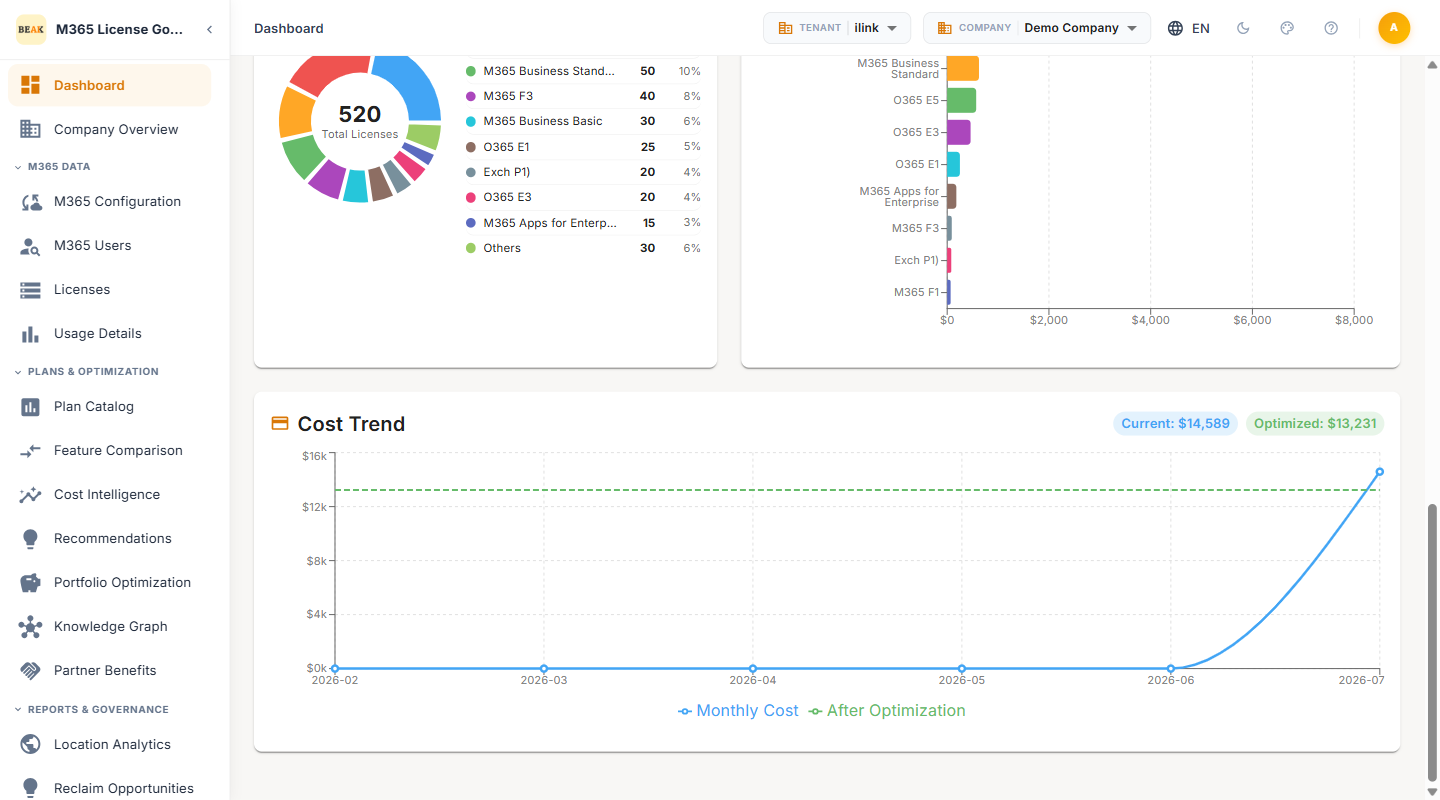
A donut chart displays the Top 10 SKUs by license count, providing a visual breakdown of how licenses are distributed across your M365 estate.
Each segment represents a license SKU with its count and proportion of the total. Hovering over any segment reveals the exact license count and percentage for that SKU.
Monthly Cost by License
A bar chart breaks down the monthly cost contribution of each license SKU. Bars are sorted by cost in descending order, making it immediately visible which SKUs drive the majority of spend. Use this chart to identify the highest-cost SKUs and prioritize optimization efforts accordingly.
Cost Trend
The Cost Trend line chart tracks monthly license spend over time, comparing two trajectories:
- Current Spend — The actual monthly M365 license cost
- Optimized Spend — The projected monthly cost if all optimization recommendations were implemented
The gap between the two lines represents the achievable savings at each point in time, providing a clear visualization of the optimization opportunity and progress over prior periods.
Savings Breakdown
A bar chart quantifies the monthly savings contribution by recommendation category:
- Downgrades — Savings from migrating users to lower-cost plans
- Removals — Savings from removing licenses from inactive or redundant accounts
- Upgrades — Net savings from consolidating add-on licenses into higher-tier plans
This chart makes it clear which recommendation category represents the dominant savings opportunity.
Top Savings Opportunities
A table lists the individual users with the highest per-user savings potential, sorted by monthly cost impact in descending order.
| Column | Description |
|---|---|
| User | User display name and email address |
| Action | Recommended action — Remove or Downgrade |
| Current License | The user's currently assigned M365 license SKU |
| Recommended | The target license (for downgrades) or removal indicator |
Common patterns surfaced in this table include:
- Inactive users — Accounts with no sign-in activity within the reporting period, recommended for license
Remove - Automation mailboxes — Application and service accounts (e.g., automation@, noreply@) assigned paid licenses that can be removed or replaced with free alternatives
- Over-licensed users — Users assigned E5 or E3 licenses who only consume Exchange and Teams, recommended for
Downgradeto E1 or Business Basic
Note: Review each recommendation individually before taking action. Some accounts flagged as inactive may be shared mailboxes, break-glass accounts, or seasonal users that require license retention.
Inactive Users
The Inactive Users section highlights user accounts with active license assignments but no recent M365 service activity. These represent direct cost waste.
- Total Wasted Spend — Aggregated monthly cost across all identified inactive license assignments
- Details Shown — User name, email address, assigned license SKU, last activity date, and monthly license cost
Inactive user licenses are the fastest path to cost recovery — removing or reallocating these licenses requires no migration or feature evaluation.
Best Practices
- Review recommendations weekly — License usage patterns shift as employees join, leave, or change roles. Review the Optimization Insights section at least weekly to catch new savings opportunities.
- Address compliance warnings immediately — Business License Limit warnings indicate a contractual risk. Prioritize migration to Enterprise plans before the next renewal cycle.
- Start with removals — License removals for inactive and automation accounts carry zero risk of user disruption and deliver immediate savings.
- Validate before bulk downgrades — Before executing large-scale downgrades, verify that affected users do not rely on premium features through ad-hoc or infrequent usage patterns not captured in the standard reporting window.
- Schedule recurring reports — Configure weekly or monthly report delivery to stakeholders so that optimization progress is tracked without manual dashboard checks.
- Monitor Cost Trend continuously — Use the Cost Trend chart to validate that implemented optimizations are reflected in actual spend reductions over subsequent billing cycles.
Related Pages
- Beak M365 License Optimizer Overview — Platform overview, navigation structure, and getting started guide