Observability
Note: This setting moved into the team editor
Since AI Governance became part of the AI Security & Governance console, this is no longer a screen of its own. The toggle is unchanged — turn tracing on per team in Govern → Teams → <team>, beside the team's other settings.
/aigateway/observabilityredirects to the Teams list.
Observability is the per-team toggle that streams every LLM request made through the Gateway as a trace into Beak AI Observability. Traces include the model, tokens, cost, latency, and the agent context passed from the Runtime — everything needed to debug a bad response without instrumenting the agent code.
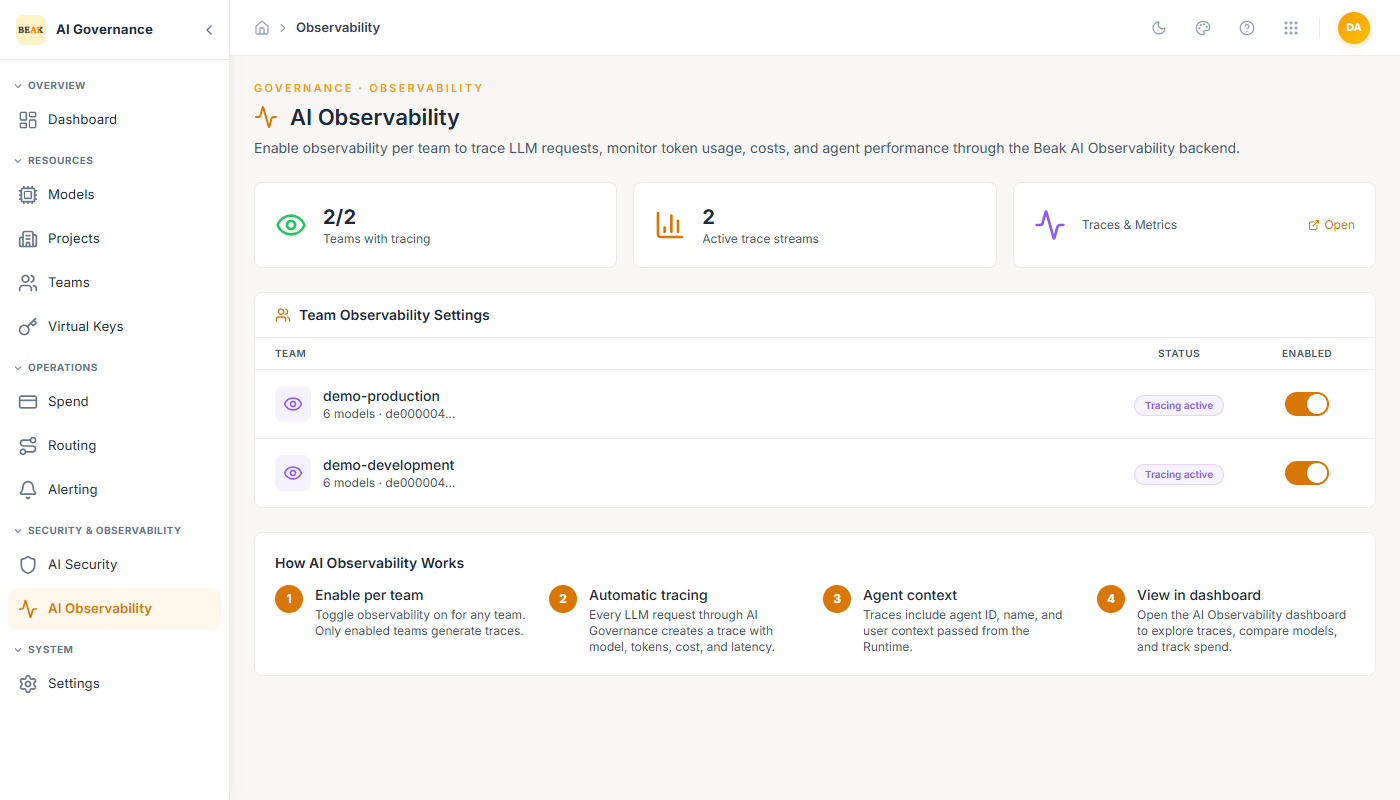
Headline Tiles
- Teams with tracing —
X / Yteams that have tracing enabled. - Active trace streams — Number of live streams currently emitting traces.
- Traces & Metrics — Open link jumps into the Beak AI Observability dashboard for the tenant.
Enabling per Team
The Team Observability Settings table lists every team with a status chip and a toggle. Flip the toggle to turn tracing on or off; Tracing active appears next to enabled teams.
Tracing is independent of AI Security — teams can run either, both, or neither. Running both is the norm for production teams; the overhead is small and the combined data is far more useful than either signal in isolation.
How Observability Works
- Enable per team — Toggle observability on for any team. Only enabled teams generate traces.
- Automatic tracing — Every LLM request through the Gateway Manager creates a trace with model, tokens, cost, and latency.
- Agent context — Traces include agent ID, name, and user context passed from the Runtime, so agent-level rollups on the Observability Dashboard work out of the box.
- View in dashboard — Open the Observability Dashboard to explore traces, compare models, and track spend.
Best Practices
- Turn tracing on for every production team. The cost is negligible; the forensic value when something goes wrong is large.
- For dev / staging teams, decide per-environment. Full-fidelity tracing in dev is useful when the team is actively iterating; less so for idle integration environments.
- Don't double-count spend. The Gateway's Spend page and the Observability dashboard's spend tile come from the same data — prefer one as the source of truth for finance reporting.
- Pair Observability with AI Security for incident review. A blocked request has a trace that explains which validator fired.