Core Features
Beak AI Observability is the diagnostic layer for every agent run in the platform. It ingests traces from the AI Runtime and the AI Gateway, indexes them by agent, model, and status, and exposes four layers of insight — volume and cost metrics on the Dashboard, end-to-end span inspection under Traces, automated quality scoring under Evaluations and Model Comparison, and failure diagnosis under Drift Detection, Root Cause, and Anomaly Alerts.
Workspace Layout
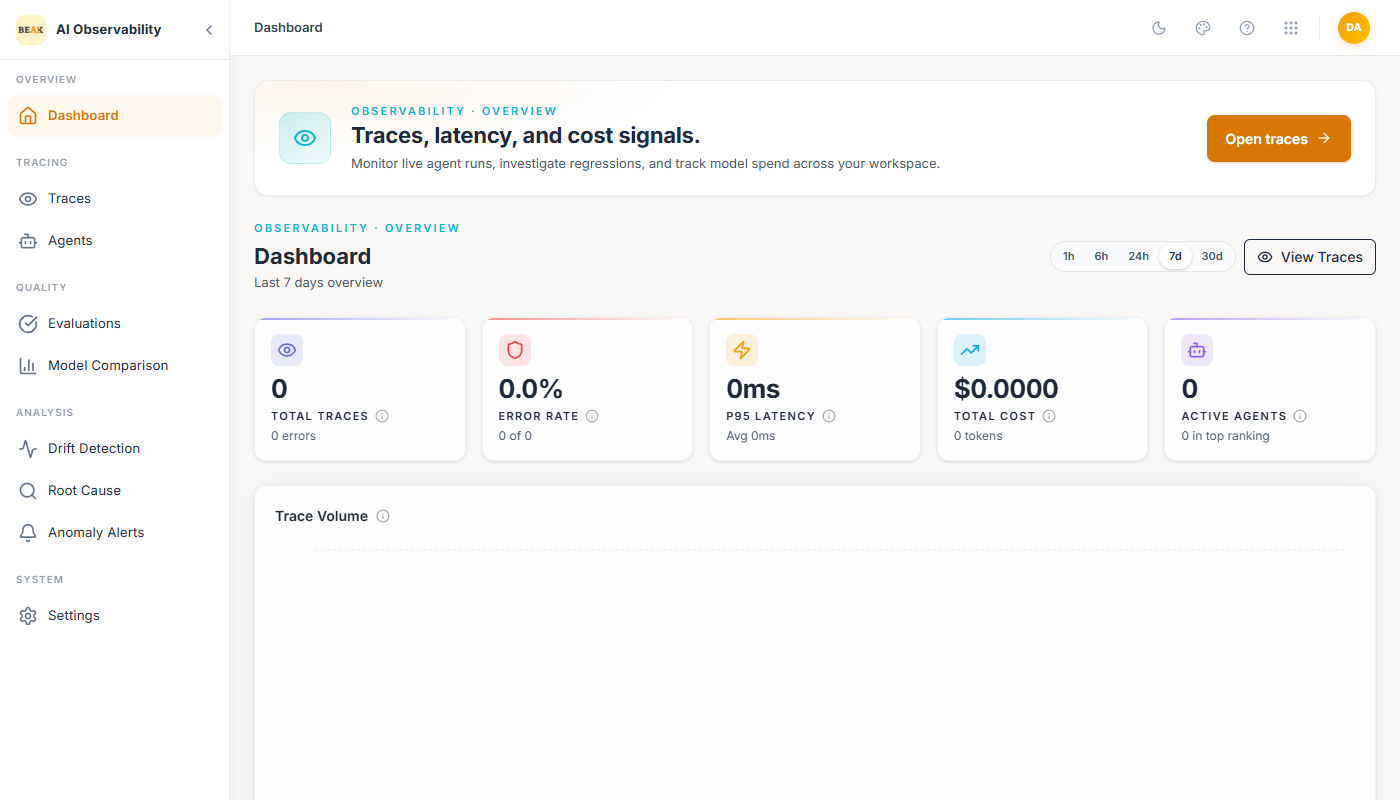
The left navigation groups every screen into five sections:
- Overview —
Dashboard. Rolled-up metrics and recent activity for the selected time range. - Tracing —
Traces,Agents. The raw span data and its per-agent aggregation. - Quality —
Evaluations,Model Comparison. Automated quality scoring and cross-model benchmarking. - Analysis —
Drift Detection,Root Cause,Anomaly Alerts. Signal extraction on top of traces — what changed, why a batch of errors happened, and when a metric crosses a threshold. - System —
Settings. Retention, sampling, and export controls.
Every list view shares the same conventions: filters at the top (agent, model, status, time range), a primary action button when relevant, and per-row drill-through into the full detail.
Dashboard
The Dashboard is the starting point. It shows Total Traces, Error Rate, P95 Latency, Total Cost, and Active Agents for the selected window (1h, 6h, 24h, 7d, 30d), a Trace Volume area chart, and two drill-down tables — Top Agents by Volume and Recent Errors. See Dashboard.
Traces
A trace is the complete record of one agent turn — every LLM generation, tool call, datasource query, and sub-agent invocation, captured as spans in a parent–child tree. The Traces page lists every trace with its status, duration, tokens, and cost; clicking a trace opens the span tree with per-span input, output, metadata, and timeline tabs. See Understanding a Trace.
Agents
Agents rolls trace data up by agent identity. Each agent's card shows volume, error rate, average cost, and ranking over the last 24 hours, so a regressing agent surfaces against the fleet without hunting through individual traces. See Agents.
Evaluations
Evaluations are automated quality pipelines that score traces on dimensions like groundedness, faithfulness, and answer relevance. Three evaluator families are supported out of the box: RAGAS, LLM-as-a-judge, and custom evaluators. See Evaluations and Adding Datasets.
Model Comparison
Model Comparison sits alongside Evaluations and answers a different question: for the same workload, how do the models in use compare on quality, cost, and latency? Once traces from multiple models have been ingested the view renders a side-by-side breakdown. See Model Comparison.
Drift Detection
Drift Detection computes PCA projections of trace embeddings and compares a rolling 7-day baseline against the last 24 hours. Distribution shift — users asking different questions, an agent returning subtly different answers — shows up as cluster movement in the 2D projection. See Drift Detection.
Root Cause
Root Cause is an on-demand report that takes recent error traces, groups them by pattern, and asks an LLM to summarize the likely causes and recommended fixes. It is the fastest path from "we have a spike in errors" to "here is the specific span and argument that explains them." See Root Cause.
Anomaly Alerts
Anomaly Alerts is z-score based thresholding on the same metrics the Dashboard shows — Error Rate, P95 Latency, Cost, Throughput. Each alert config binds a metric, a condition (Above / Below), and a threshold. The Recent Alerts feed renders fired alerts with severity (critical / warning) and the agent that breached. See Anomaly Alerts.
Settings
Settings exposes data retention TTL, trace sampling, embedding API configuration, and export controls for the workspace. See Settings.