Dashboard
The Dashboard is the landing page of AI Observability. Everything shown on this screen is scoped to the time range picker in the top-right (1h · 6h · 24h · 7d · 30d, default 7d). Use it to get a one-glance picture of the fleet, then drill into a specific trace, agent, or error from the tables at the bottom.
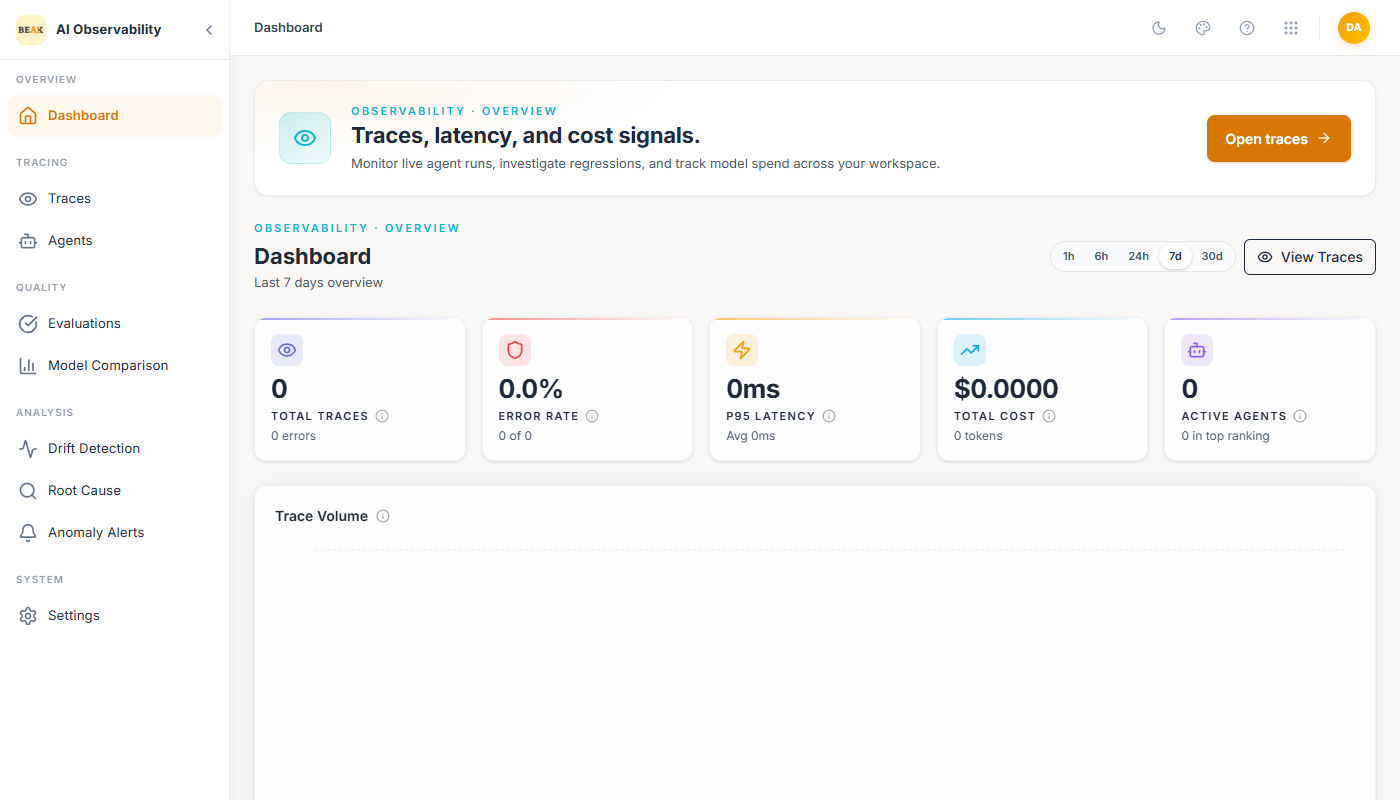
Metric Tiles
Five metric tiles sit at the top of the page. Each tile shows the current value, a secondary qualifier (count, average, token total, ranking), and a tooltip explaining what the metric means.
- Total Traces — Count of trace records ingested in the window. The secondary line shows the number of error traces in that count.
- Error Rate —
error traces / total traces. Rendered as a percentage with the rawX of Ycount below. - P95 Latency — 95th-percentile duration across all traces. The secondary line shows the average.
- Total Cost — Aggregate LLM cost in USD, computed from the Gateway's per-model rates. The secondary line shows total tokens consumed.
- Active Agents — Count of distinct agents that produced at least one trace in the window. The secondary line flags the top N ranked on the Agents page.
Trace Volume
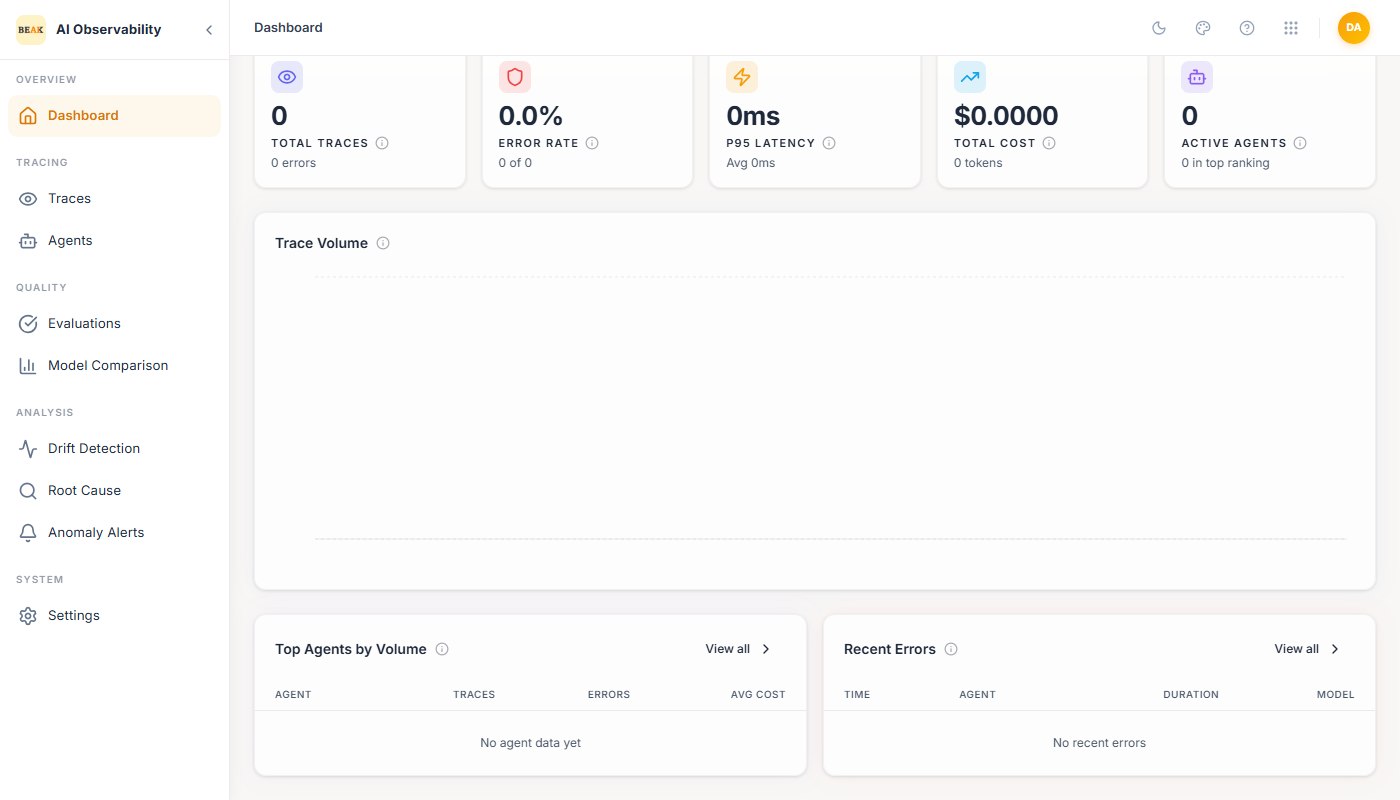
The Trace Volume chart plots traces per bucket across the window with two overlaid series:
- Orange — Successful traces.
- Red — Error traces.
Hovering on the chart surfaces per-bucket counts. The bucket size auto-adjusts to the selected window (1h → per-minute buckets; 30d → per-day buckets).
Top Agents by Volume
The first drill-down table ranks the five highest-volume agents in the window. Each row shows:
- Agent — Name from AI Studio. Click to open the agent's card on the Agents page.
- Traces — Count in the window.
- Errors — Count of error traces. Rendered in red when non-zero.
- Avg Cost — Mean cost per trace.
View all → opens the full Agents page.
Recent Errors
The second drill-down table surfaces the most recent error traces. Each row shows:
- Time — Local timestamp.
- Agent — Name of the agent that produced the error, rendered in red.
- Duration — End-to-end latency for the errored turn.
- Model — The model the errored span used (e.g.
gpt-4o).
Click a row to open the trace in the Traces viewer.
Shortcut Actions
View Traces in the top-right opens the Traces list scoped to the same time window. It is the fastest way to move from metric inspection to span inspection.
Best Practices
- Start every investigation on the Dashboard at a 24h window, then zoom in to the bucket the chart spikes in.
- The
Active Agentstile surfaces silent regressions — a drop from 10 to 6 overnight is usually more actionable than an error-rate blip. - Treat
Recent Errorsas a triage queue. If the same agent appears in three consecutive rows, open Root Cause instead of clicking each trace individually.