Dashboard
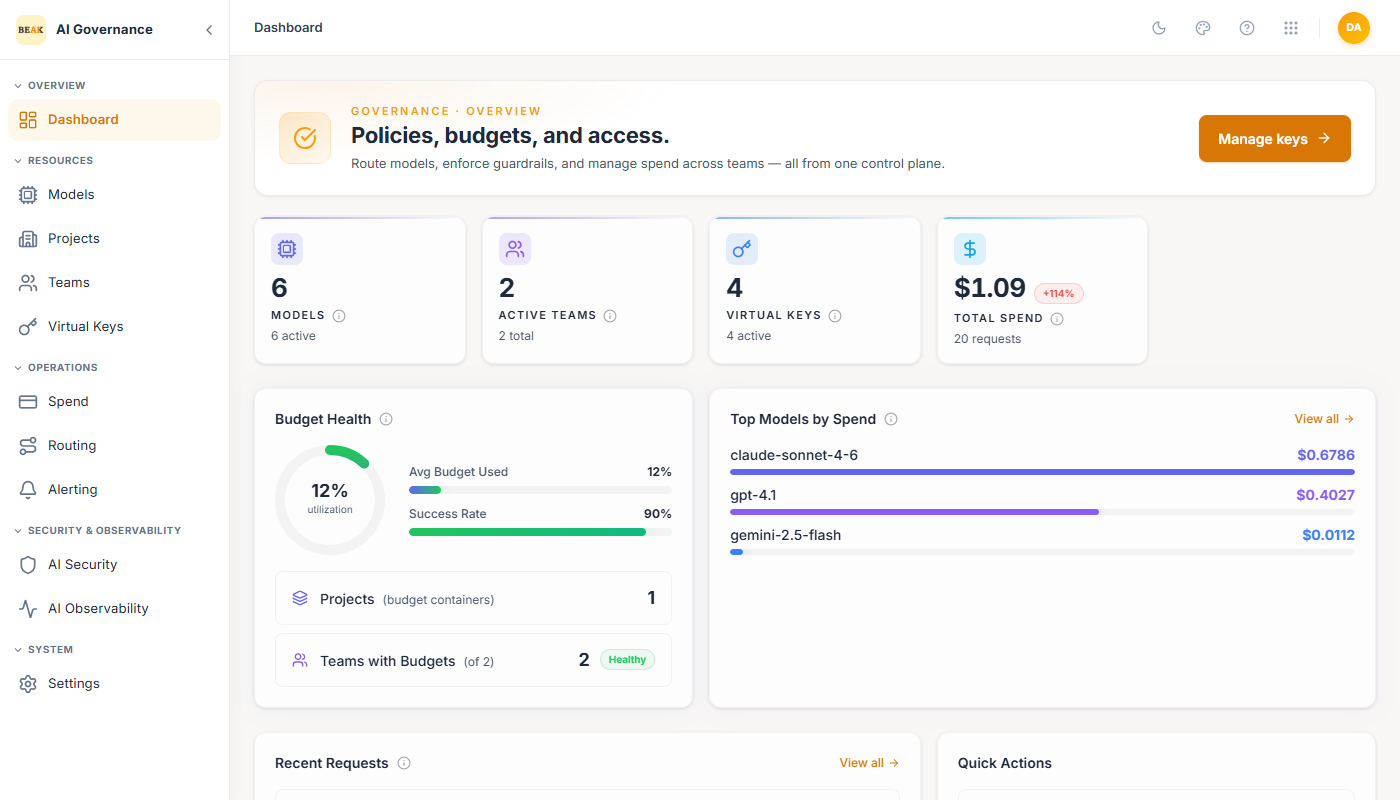
The Dashboard is the landing page of Beak AI Gateway. It shows the state of every registered resource in a single view so builders and admins can spot a budget problem, a missing credential, or a runaway model before drilling into one of the detailed pages.
Headline Tiles
Four tiles sit at the top of the page, each with a tooltip explaining what the metric represents.
- Models — Count of registered models followed by the count in the
activestatus. - Active Teams — Count of teams with
Activestatus. - Virtual Keys — Count of issued virtual keys that are currently active.
- Total Spend — Aggregate USD spent across all requests, with a percentage delta against the prior period and the total request count.
Note: There is no separate credentials tile. Provider API keys are entered on the model that uses them rather than in a credential store of their own — see Models.
Budget Health
The Budget Health panel tracks how close the fleet is to exhausting configured budgets:
- Utilization gauge — Overall percentage of all team budgets consumed.
- Avg Budget Used — Mean consumption across teams.
- Success Rate — Share of requests that returned
success(vs. rate-limited, budget-exceeded, or errored). - Projects — Count of budget containers defined.
- Teams with Budgets —
X of Yteams whose budgets are configured, with aHealthychip when all configured budgets are well under their caps.
Top Models by Spend
A bar chart ranking the top models by total spend in the current period. Each row shows the model name, a bar sized to its share of spend, and the absolute USD value. View all → opens the full Spend page.
Recent Requests
A live-updating feed of the most recent requests served by the Gateway. Each row shows the model, the request token count, the spend, and the provider. View all → opens the transaction log on the Spend page.
Quick Actions
The right-hand Quick Actions panel links straight into the four most common builder tasks:
- Add Model — Open the Models create form.
- Create Team — Open the Teams create form.
- Generate Key — Open the Virtual Keys generate modal.
- View Spend — Open the Spend analytics view.
Best Practices
- Start every day on the Dashboard. The Budget Health gauge and the
+X%chip on Total Spend catch most anomalies before they land as user complaints. - Treat the Quick Actions panel as the authoritative entry point — if a different shortcut sends you somewhere else, the Dashboard shortcut is the canonical flow.
- Pair the Dashboard with Alerting. The Dashboard tells you the state; alerts tell you when it changes.