Spend
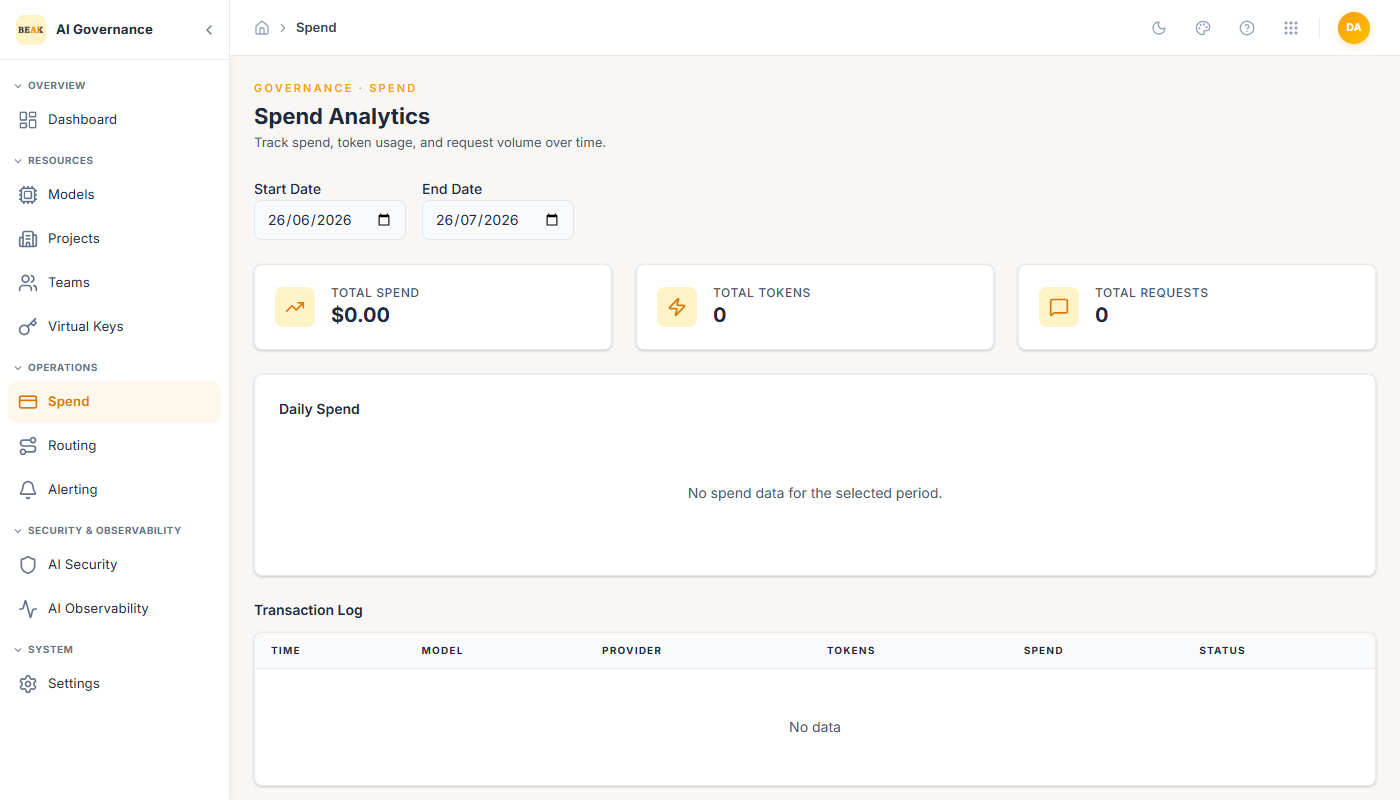
Spend is the analytics view over every request that has passed through the Gateway. It rolls up total spend, tokens, and request count for the selected date range, plots the daily trend, and drops straight into the transaction log for per-request detail.
Date Range
Two date pickers — Start Date and End Date — scope everything else on the page. The default is the last 30 days. Both tiles and chart recompute when the range changes.
Headline Tiles
- Total Spend — Aggregate USD across all requests in the range.
- Total Tokens — Combined prompt + completion token count.
- Total Requests — Count of distinct requests the Gateway served.
The three are cross-checkable: dividing Total Spend by Total Tokens gives the effective per-token rate for the period, which should sit between the cheapest and most expensive provider in use.
Daily Spend Chart
An area chart plotting per-day USD spend across the selected range. Useful for catching spikes (runaway loops, a jailbroken virtual key) against a stable baseline.
Transaction Log
Every request served in the range, newest first:
- Time — Local timestamp.
- Model — Display Name of the model used.
- Provider — Upstream provider (e.g.
AZURE,ANTHROPIC,GOOGLE). - Tokens — Total tokens (prompt + completion) for the request.
- Spend — USD cost of the request.
- Status —
success,rate_limited,budget_exceeded, orerror.
The log is the primary drill-through for any anomaly visible on the Dashboard or in a fired Alert. Narrow the date range to the affected window and the log becomes a short, readable incident report.
Best Practices
- Pin the date range to the period covered by an alert before sharing a Spend link — screenshots of "Spend: $X" without the window context are misleading.
- Use Total Spend ÷ Total Requests as a coarse "cost per call" KPI. A jump usually means the routing config is sending traffic to a more expensive model than before; verify against Routing.
- Export-heavy reporting belongs in a warehouse, not screenshots of the Daily Spend chart. Pair this page with the upstream data pipeline for audit needs.