Firewall Module
The Firewall Module gives your NOC team a unified view of all firewall devices — from real-time CPU and memory health to rule analysis, threat detection, VPN tunnel status, and compliance posture. It consolidates data that would otherwise require logging into each firewall individually, surfacing the most important operational metrics in a single dashboard.
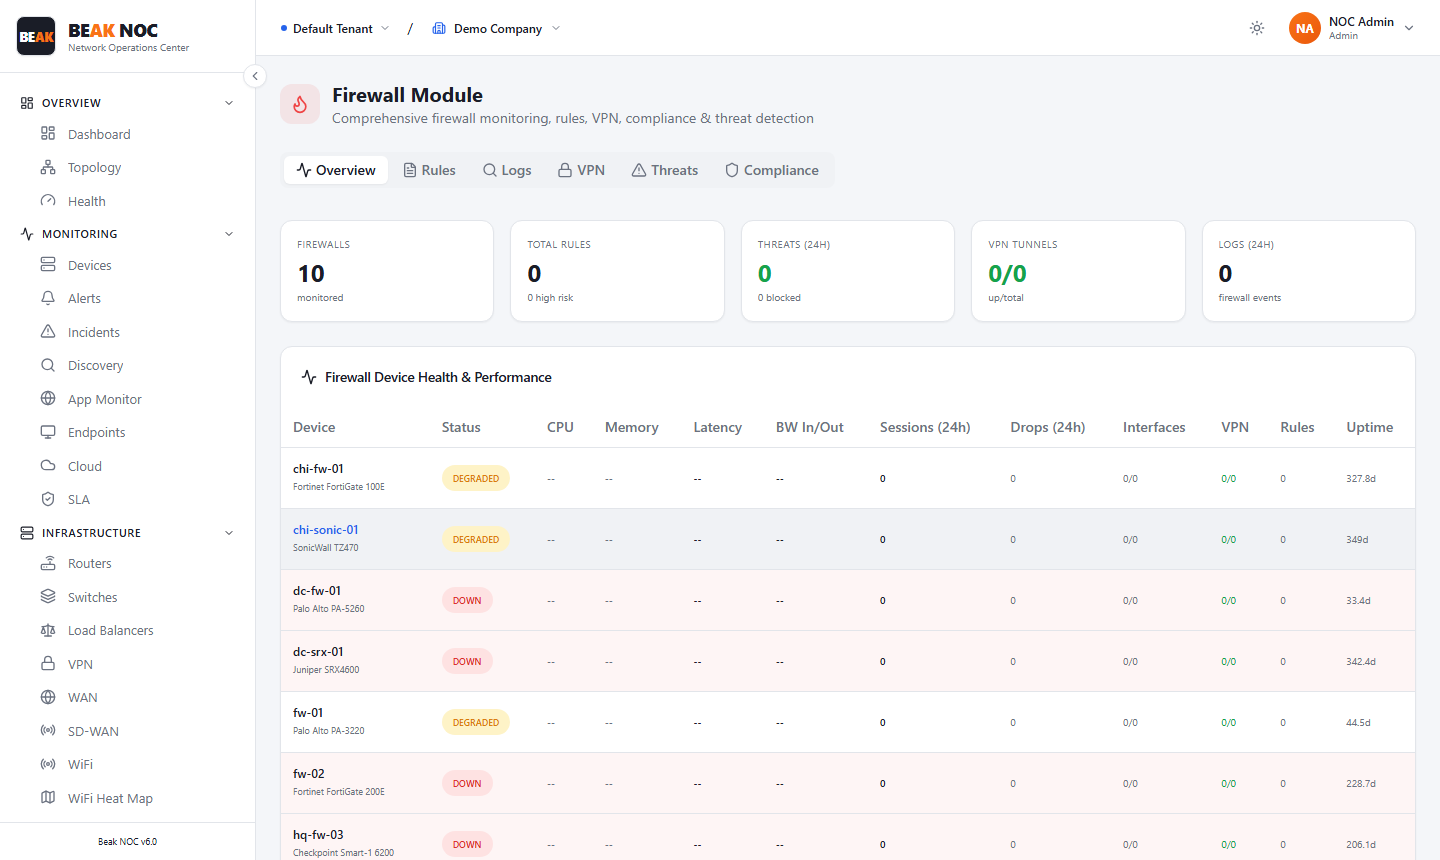
Summary Cards
| Card | Description |
|---|---|
| Devices | Total number of firewall devices under monitoring |
| Rules | Aggregate count of firewall rules across all devices |
| Threats | Total threats detected across all firewalls in the current period |
| Active/Total | Ratio of active policy groups to total configured policy groups |
| Events | Total firewall events logged in the monitoring period |
Tabs
The Firewall Module is organised into five tabs:
| Tab | Description |
|---|---|
| Overview | Device health summary with CPU, memory, throughput, and session metrics |
| Logs | Raw firewall log entries with filtering by device, severity, and event type |
| Rules | Rule inventory with hit counts, last-matched timestamps, and unused rule identification |
| VPN | VPN tunnel status aggregated from all firewall devices |
| Threats | Blocked threats, intrusion attempts, and categorised threat events |
| Compliance | Firewall configuration compliance against defined security policies |
Firewall Device Health & Performance Table
The main table on the Overview tab lists every monitored firewall with the following columns:
| Column | Description |
|---|---|
| Device | Firewall hostname or identifier |
| Status | Online or Offline based on last poll |
| CPU | Current CPU utilisation percentage, colour-coded by threshold |
| Memory | Current memory utilisation percentage |
| Latency | Round-trip latency to the device in milliseconds |
| BW In/Out | Current inbound and outbound bandwidth throughput |
| Sessions (24h) | Number of active and new sessions in the last 24 hours |
| Groups (24h) | Policy group hit counts in the last 24 hours |
| Interfaces | Count of monitored interfaces on this device |
| VPN | Number of VPN tunnels associated with this firewall |
| Rules | Total rule count configured on the device |
| Options | Actions — view details, drill into logs, manage rules |
Logs Tab
The Logs tab provides a real-time and historical view of firewall log entries. Filters available:
- Device — Scope logs to a single firewall
- Severity — Filter by Critical, High, Medium, Low, Informational
- Event Type — Filter by Allow, Deny, Drop, NAT, VPN, Threat
Each log entry shows timestamp, source IP, destination IP, port, protocol, action taken, and the rule that matched.
Rules Tab
The Rules tab inventories all firewall rules across all devices:
- Rule Name / ID — Identifier as configured on the firewall
- Device — Which firewall this rule belongs to
- Action — Allow, Deny, or Drop
- Hit Count — Number of times this rule has been matched
- Last Hit — Timestamp of the most recent rule match
- Unused Rules — Rules with zero hit count over the selected period are flagged — candidates for cleanup
Threats Tab
Blocked and detected threats are listed with:
- Time — When the threat was detected
- Device — Firewall that detected it
- Threat Name — CVE reference or threat category (e.g., Malware, Port Scan, Brute Force)
- Severity — Critical, High, Medium, Low
- Source / Destination — IPs involved
- Action — Whether the traffic was blocked or alerted
Best Practices
- Investigate high CPU (above 80%) — CPU spikes on firewalls often correlate with DDoS activity, large rule sets, or logging overhead. Check the Threats tab for concurrent events.
- Review unused rules quarterly — Unused rules in the Rules tab are security debt. Remove or disable them to reduce attack surface and simplify audits.
- Monitor session counts for anomalies — An unusual spike in sessions (24h) may indicate connection flooding or scanning activity originating from inside the network.
- Correlate VPN tunnel drops with latency — If a VPN tunnel shows as down, cross-reference latency metrics to determine if the underlying WAN path is degraded.
Related Pages
- Security Operations Center — Aggregate security posture scoring
- VPN Monitoring — Dedicated VPN tunnel monitoring across all device types
- Compliance — Firewall configuration compliance in the compliance framework