Agents
The Agents page rolls trace data up by agent identity. Instead of scanning thousands of individual traces, you see each agent's volume, error rate, and average cost in one place — the fastest way to spot a regressing agent against the rest of the fleet.
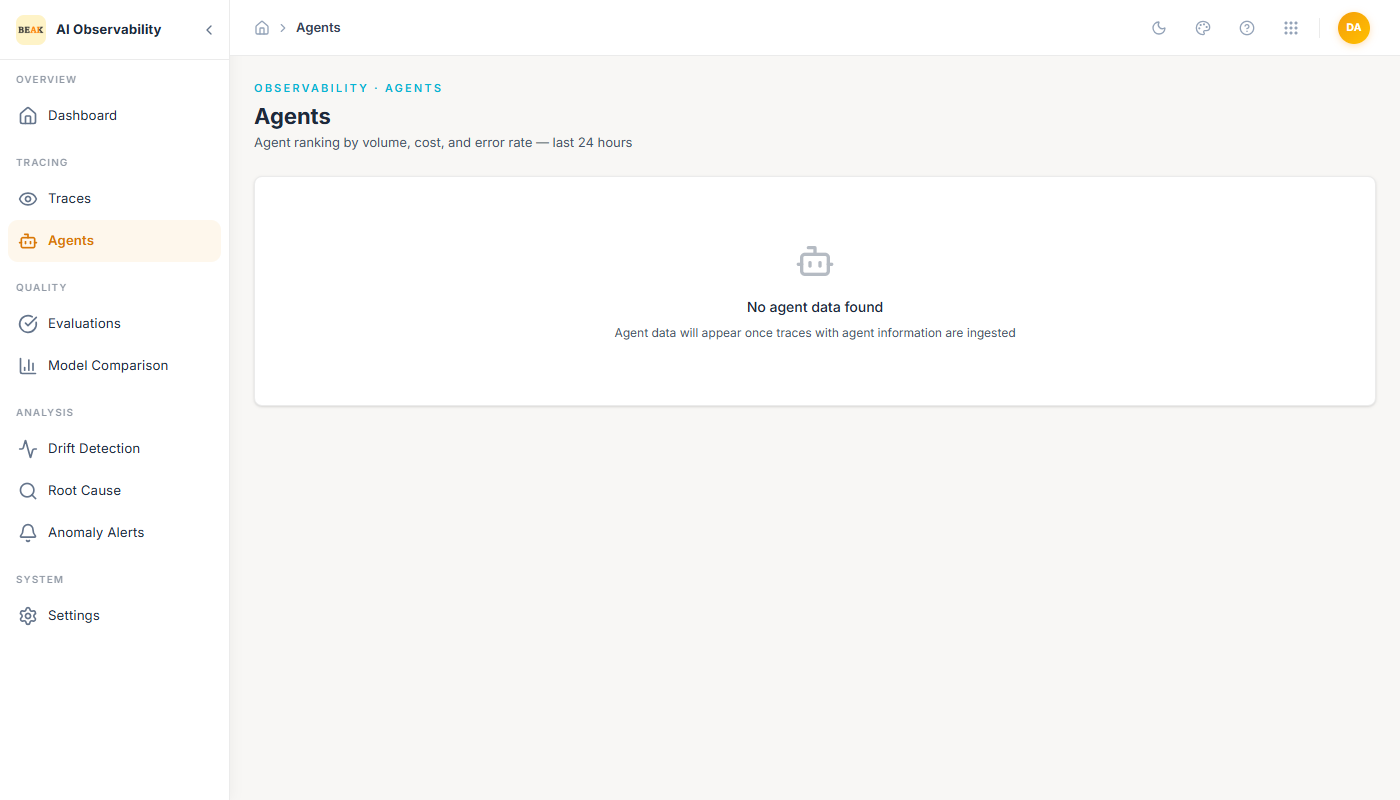
The window is fixed at last 24 hours. Agents with no traces in that window do not appear — the empty state shown above is normal for a quiet workspace.
Ranking
Each agent row surfaces four numbers:
- Volume — Trace count in the last 24 hours. Drives the default ranking.
- Error Count — Count of error traces. Rendered in red when non-zero.
- Avg Cost — Mean USD cost per trace across the window.
- Rank — Position in the top-N. Tied into the
Active Agentstile on the Dashboard.
The page is also reachable from any trace viewer via the Agent Analytics button in the top-right — useful when you're already inside a failing trace and want to see whether the same agent is failing elsewhere.
Reading the Page
- If a single agent dominates volume, the fleet's Dashboard metrics are effectively that agent's metrics. Treat Dashboard regressions as that agent's regressions until proven otherwise.
- A high error count on a low-volume agent is almost always a bug in that agent's skill or system prompt — the small sample means one bad path is being hit repeatedly.
- A high average cost with normal token counts points at an expensive model selection — pair the finding with Model Comparison before changing prompts.