Infrastructure Alerting & Monitoring
Overview
Infrastructure alerting and monitoring refers to the practices and tools used to monitor the health, performance and security of an organization's IT infrastructure — servers, networks, databases, applications and other critical components.
The primary goal is to detect and respond to potential issues, anomalies or failures proactively, before they impact operations or services.
Scenario
A few computers in the New Jersey location have been behaving unpredictably — slowness and unexpected reboots that affect daily productivity.
While the root cause is investigated, David asks a support admin to monitor the CPU performance of those computers, and wants an alert email every time CPU utilization goes above 90%.
Alert Templates
An Alert Template is an integral part of the monitoring framework — it alerts the user whenever a monitoring criterion is met.
Alert templates are managed on the Automation page under the Alert page-group. Open Sidebar > Automation, set the page-group selector to Alert and stay on the Alert Template tab. The list shows each template with its Mode of Alert, Severity and Use Type.
Click Create New Alert Template to create one.
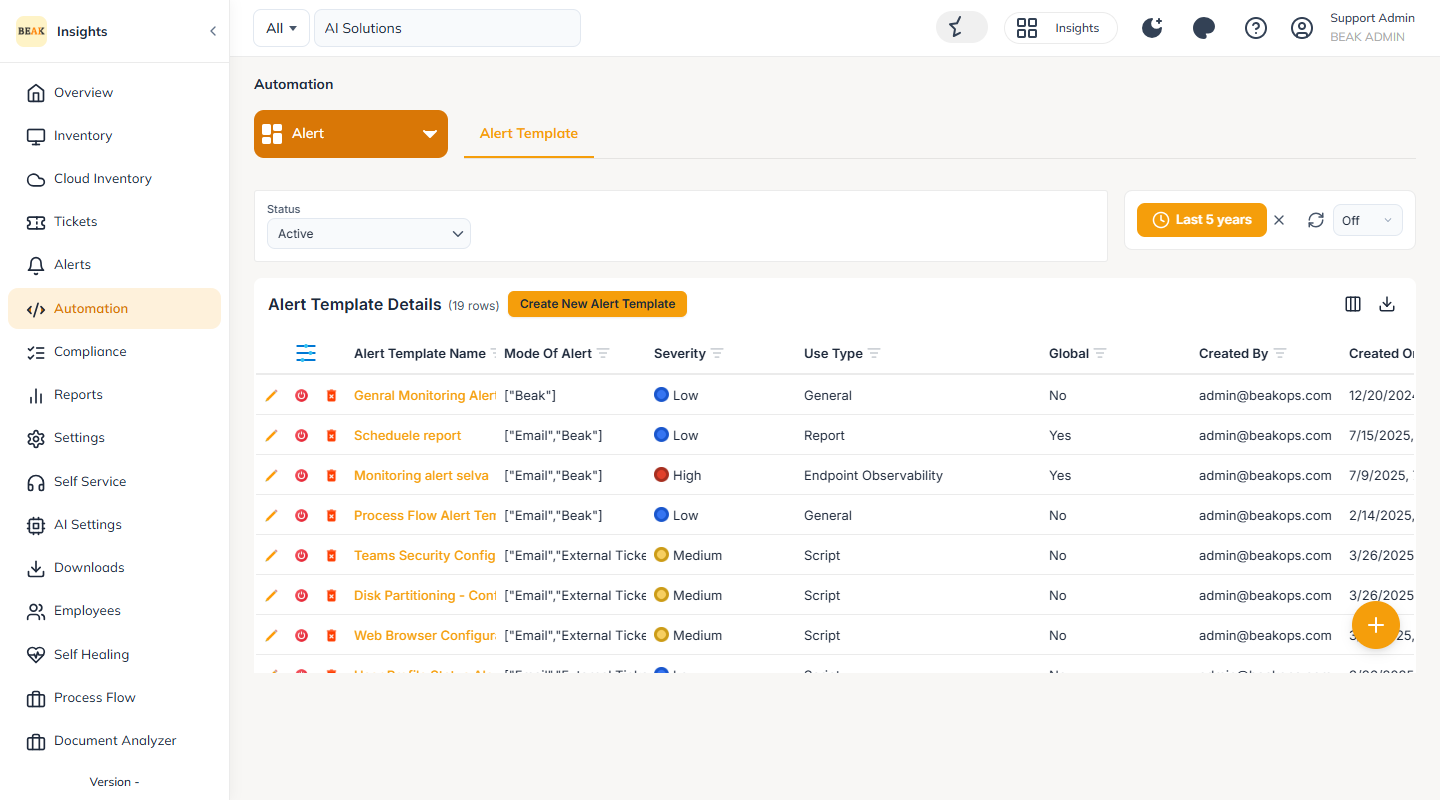
An Alert Template can be created at the Global level (in Global Settings, for use across all companies) or from the Automation menu at the company level.
Note: BEAK also lets you create an Alert Template inline while creating jobs for other modules — Scan, Discovery, Patch and Script. During job creation you can select an existing alert template or create a new one, so you receive alerts on the outcome (
Success/Failure/Terminate).
Alert Template Details
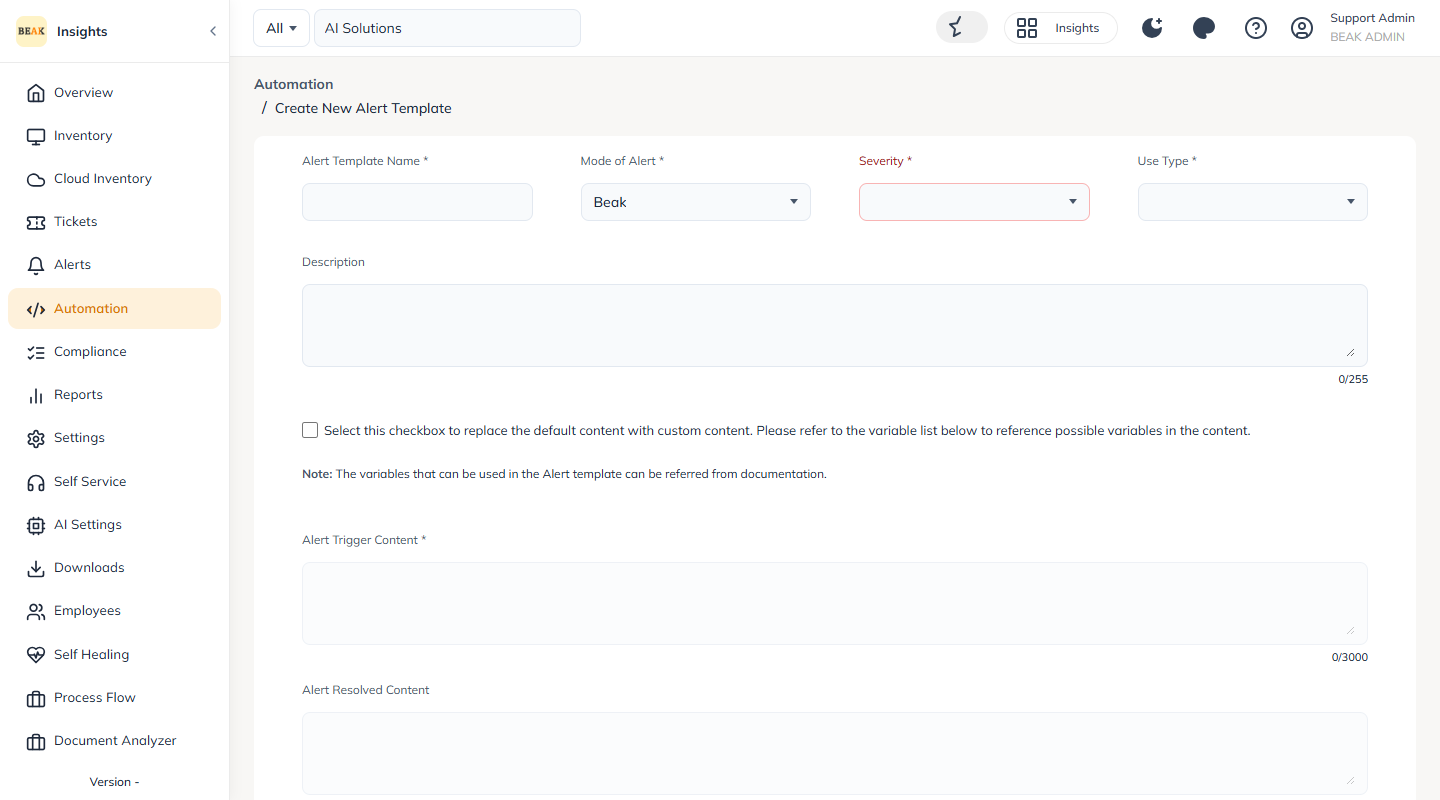
On the Create New Alert Template form, provide:
- Alert Template Name — the name of the template
- Mode of Alert — Beak (selected by default) generates in-platform alerts; selecting Email sends alert emails to the configured users, with To/CC recipients and a subject
- Severity — the alert severity, defined by the user
- Use Type — lets you integrate the alert template across the other modules and scenarios
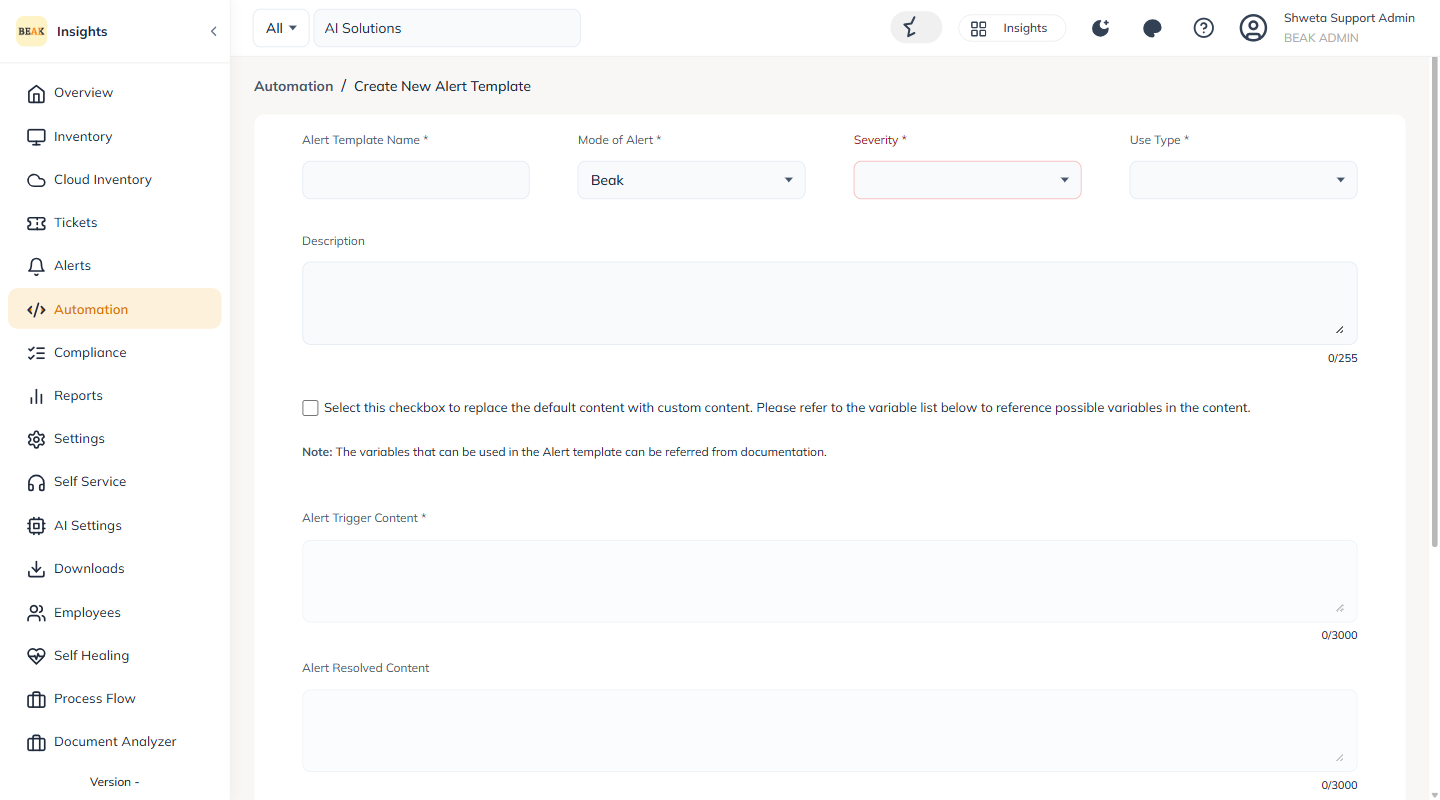
- Custom content — select the checkbox to replace the default content and edit the Alert Trigger Content, Alert Resolved Content and Remediation Content, using variables as required
Post Alert Actions can also be configured to run a script job after an alert is created — for example, running a disk-cleanup script when a "C drive full" alert is raised.
Monitoring Templates
A Monitoring Template defines the monitoring parameters applied to the assets that need to be monitored.
Monitoring templates are managed on the Automation page under the Monitoring page-group. Set the page-group selector to Monitoring, stay on the Monitoring Template tab, then click Add Monitoring Template.
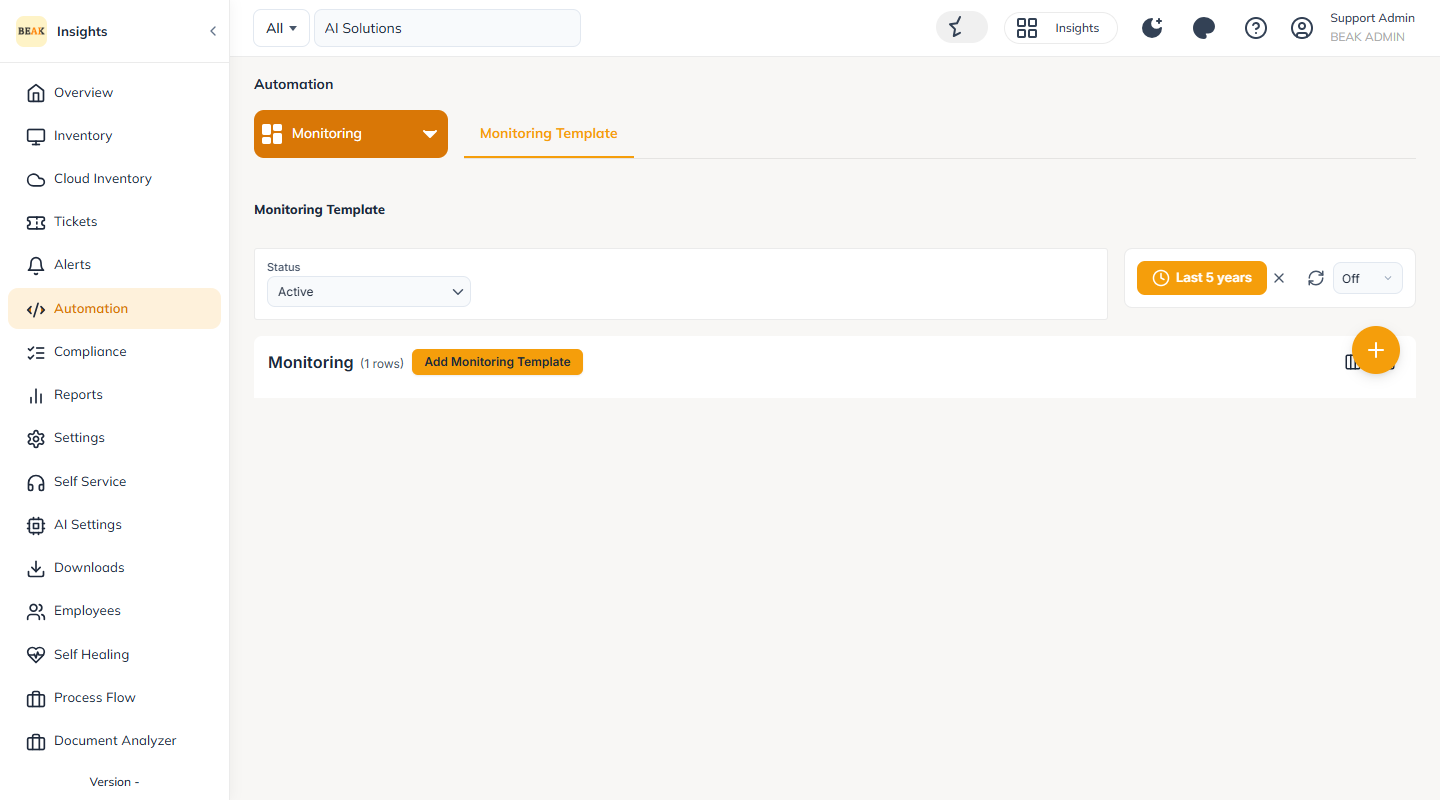
Monitoring templates can be created at the Global level (for use across all companies) or at the company level.
Monitoring Template Details
On the Add Monitoring Template form, provide:
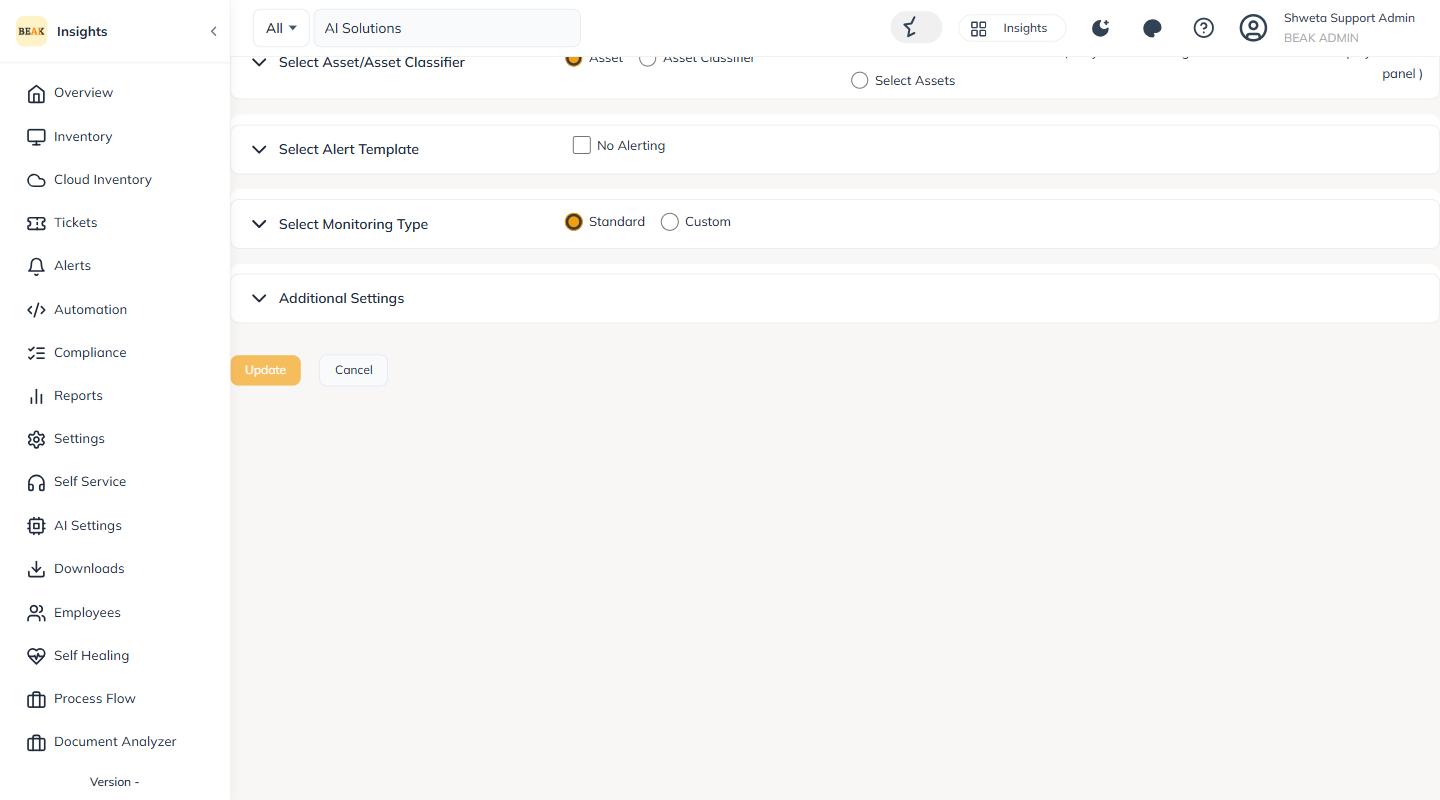
- Select Asset / Asset Classifier — All Assets, a specific asset classifier, or selected assets. Only monitoring-enabled assets are displayed.
- Select Alert Template — choose an existing alert template or create a new one. Selecting No Alerting generates no alerts.
- Select Monitoring Type — Standard (default) or Custom. For example, to monitor CPU utilization you would choose the appropriate performance monitor. Custom is used for script-based monitoring.
- Additional Settings — including a name for the monitoring template
When defining a monitor you set:
- Frequency and Unit — how often the value is checked (Hours / Minutes / Days)
- Tolerance — only raise an alert after the failure occurs a set number of times
- Operator and Value — for example, alert when CPU utilization exceeds 80%
Viewing Monitoring Alerts
Monitoring alerts can be viewed at:
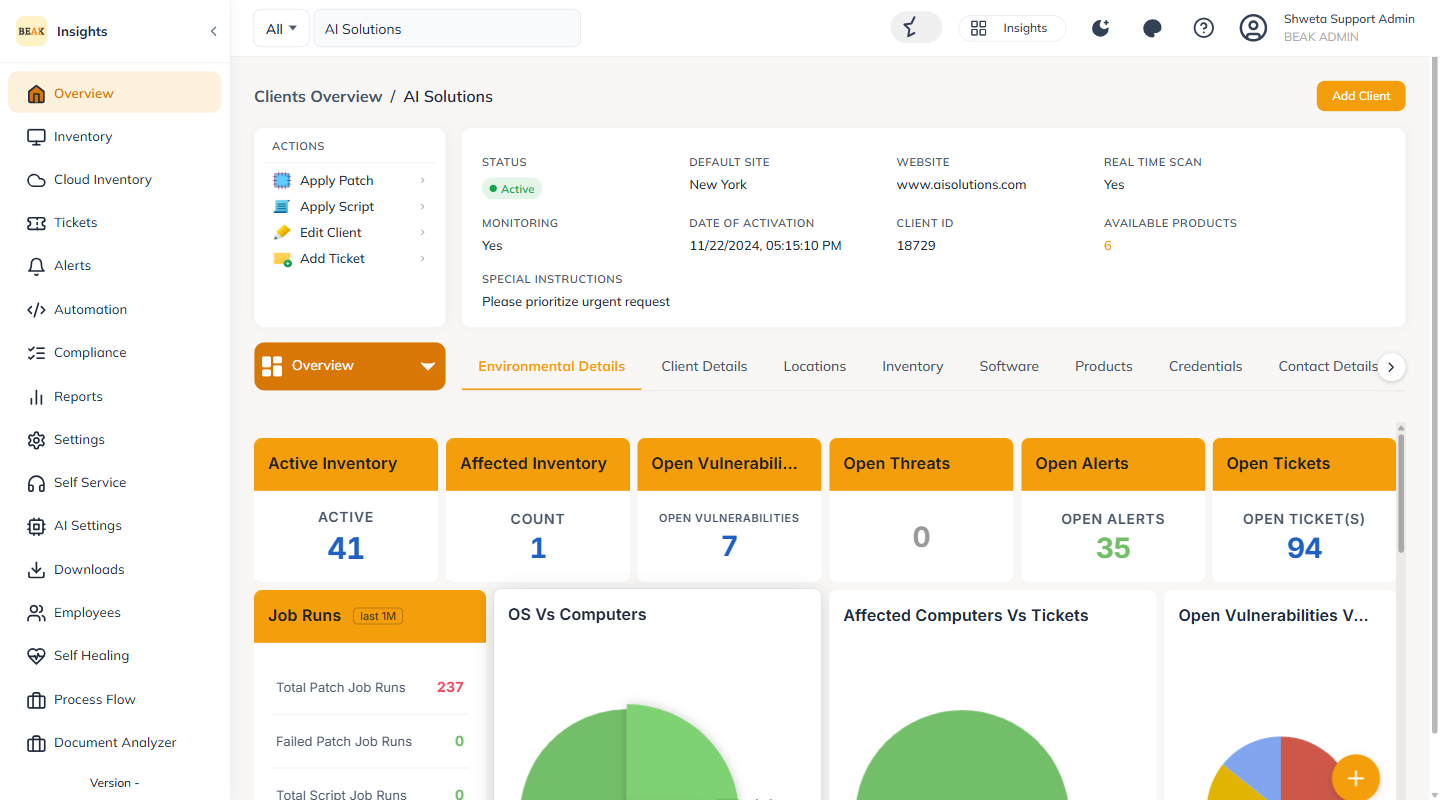
- Company Overview — the client Overview surfaces Open Alerts alongside Open Vulnerabilities, Open Threats and Open Tickets
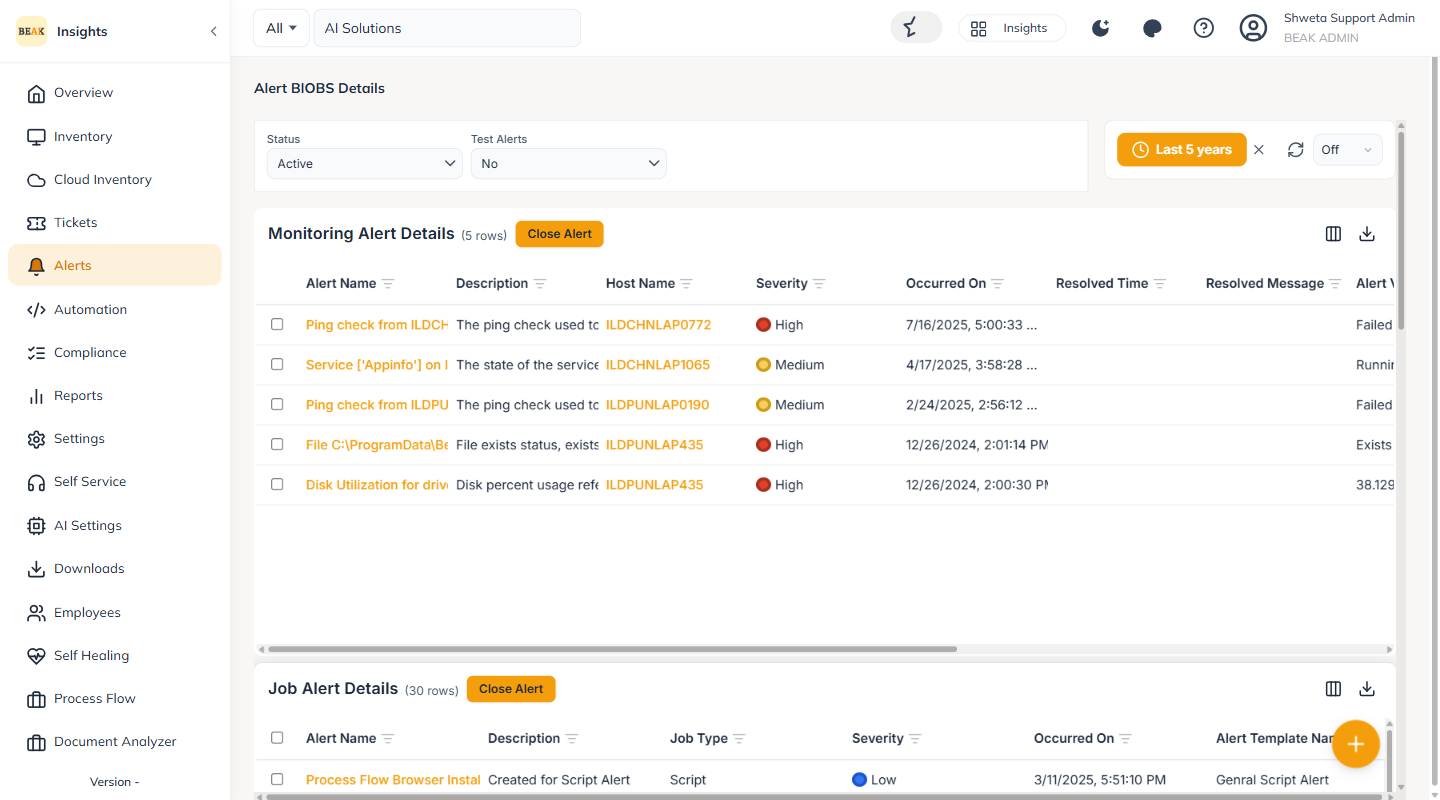
- Alerts menu — Sidebar > Alerts lists every alert with its Name, Description, Severity Type, Notification Mode, Associated Device, Monitoring Template and Alert Type
- Asset level — the alerts raised for a specific asset are shown on the asset detail page
- Alert Mail — when Email mode is configured, users also receive an alert email; the link in the email opens the alert details page on the platform
What Happens After an Alert is Generated
Whenever an alert is generated, a corresponding ticket is created.
- Client level — open the Tickets tab and use the Ticket ID hyperlink to view the ticket details
- Asset level — open the asset (Inventory > hostname), go to the Overview and choose Monitoring, then use the Ticket ID hyperlink to view details
Automating Alert and Ticket Closure
If the monitoring criterion returns to normal (a "false" condition), the previously triggered alerts and tickets are closed automatically. Auto-closed alerts are shown with their resolution message.
- Client level — review from the Alerts tab with Status =
Inactive - Asset level — review from the asset's Monitoring view
- Closed monitoring tickets are available under Reports > Monitoring > Closed Monitoring Tickets
Adding a Monitor at the Asset Level
BEAK also lets you add a Monitor directly on an asset without creating a Monitoring Template. From the asset detail page you can add a monitor — for example, a "Windows Service Exists" monitor that emails an alert if a given service exists.
Note that you can only add Monitors at the asset level; a Monitoring Template cannot be created at the asset level.
Note:
A Monitoring Template and a Monitor are different. A Monitoring Template is a template for applying monitors to assets, and can contain one or many Monitors. Multiple monitors added at the asset level can also be combined into a single template using Create as Monitoring Template.
Script Monitoring
Script Monitoring tracks the execution and outcome of scripts within the IT environment.
To set it up:
- Create a script with Monitoring selected as the Script Category Type.
- Add the required Variables — the monitoring alerts are generated from the variable outcomes.
- Give the script file a Convert to JSON suffix.
- Create a Monitoring Template and choose Custom as the Monitoring Type — the monitoring script created earlier appears automatically.
- Define the value that should raise an alert.
Script Monitoring history is available at the asset level.